Download
1 / 52
520 likes | 707 Views
Bivariate regression. The slope, explained variance, residuals. What is the formula for a slope?. A. e = mc 2 B. Y i = a + bx i + e i C. ŷ = a + bx D. y ≥ x ≥ a. What information does the slope provide?. A. whether the relationship is statistically significant

E N D
Bivariate regression The slope, explained variance, residuals
What is the formula for a slope? • A. e = mc2 • B. Yi = a + bxi + ei • C. ŷ = a + bx • D. y ≥ x ≥ a
What information does the slope provide? • A. whether the relationship is statistically significant • B. whether a case is a severe outlier, like Buchanan’s share of the vote • C. on average, what is the predicted value of y, given various values of x • D. which baseball batter is likely to hit best in the next game
What is a? • A. the y intercept • B. the value of y when x = 0 • C. where the slope crosses the y a axis • D. all of the above
Bivariate Relationships Plotting a Line
Review: Covariance • When it tends to be the case that x is greater than the mean when y is greater than the mean AND x is lower than the mean when y is lower than the mean, then there is a positive covariation
Expected value • But we may want to know more specific knowledge than that – we may want to know the expected value of y for each increased value of x • I may know the mean of everyone’s height in class • But if I know gender, then I can generate two expected values • If you remember, we are always trying to do better than the mean
Substantive effect • For every 10K dollars given in humanitarian aid, there is an increase in 3K spent on weapons • For every 10K dollars given in humanitarian aid, there is a .5K increase spent on weapons • For every 10K dollars given in humanitarian aid, there is a 8K increase spent on weapons • Unit of analysis?
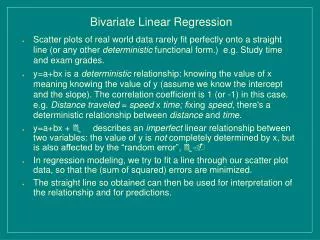
Regression equation • y = a + bx + e • ŷ = a + bx • ŷ is also known as yhat • y is the dependent variable value • yhat is the predicted value • a is the intercept
X and Y • Y X • 2 1 • 2 • 4 3 • 3 4 • 6 5 • 5 6
X and Y • Y X • 2 1 • 2 • 4 3 • 3 4 • 6 5 • 5 6
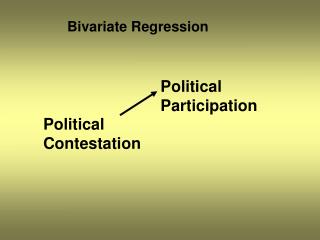
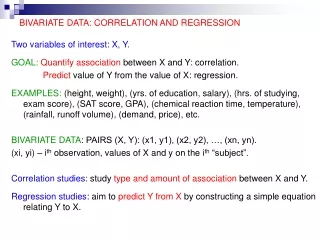
Theory Living in an urban area allows better access to prenatal care.
Output Source SS df MS Number of obs = 41 F( 1, 39) = 9.09 Model 860.523694 1 860.523694 Prob > F = 0.0045 Residual 3693.55683 39 94.7065855 R-squared = 0.1890 Adj R-squared = 0.1682 Total 4554.08053 40 113.852013 Root MSE = 9.7317 prenatalcarepctCoef. Std. Err. t P>t [95% Conf. Interval] urbanpctoftotal.2517241 .083509 3.01 0.005 .0828111 .4206371 _cons 76.35186 4.367962 17.48 0.000 67.51682 85.18689
ŷ= a + bx • b is slope – rise over run • a is the y intercept; constant • Standard error is the average error from the actual points to the slope • T is the ratio of the slope divided by the standard error • Beta = Pearson r in bivariate analysis
Occupational Prestige and Education Dependent Variable: perceived prestige of occupation
Policy Liberalism and Public Opinion (Erikson, Wright & McIver, 1987) Q: Where does the diagonal line come from?
Extending Interval Correlations • Regression and correlation are intimately related concepts. • You’ve probably all tried to map lines in Cartesian spaces before…
Thinking about two points. • The regression line connects two points: • The joint mean of X & Y • The point when the line crosses the Y axis, known as the intercept. • These two points can be used in any Rise-Run formula to compute the slope. • BUT… we really don’t calculate the regression slope this way. In fact, we calculate the slope first and then knowing it runs through the joint mean of X & Y we then compute the intercept.
In other words… • We start at the joint mean of X and Y. • We compute the slope (“b”) at that point. • We follow the line until it intercepts the Y axis.
Of course that’s the computational formula for the slope of a line and then there’s the simple alternative. There’s an approach to computing the slope of a regression line that is much closer to the way in which we computed Pearson’s r correlation coefficient. That is, … b = CovXY/VarX
The link between “r” and “b” (Part 1) bYX = rXY (sY/sX) sxysY bYX = ----------- x ------ (sxxsy) sX
The link between “r” and “b” (Part 2) rXY= b (sX/sY) sXYsX rXY = ----------- x ------ (sXxsX) sY
If it’s so easy… • The regression line is “anchored” by the point at which it crosses the Y axis when X is 0. • Different notation systems will designate the intercept as “a” or “b0”. • Computationally,… a = MeanY – bYX*MeanX
Policy Liberalism and Public Opinion (Erikson, Wright & McIver, 1987) Q: Where does the diagonal line come from?
Mean of Votes Mean of Seats
4a. Correlation Formula Covariance of X & Y = 222.058/9 = 24.673 SD of X = 3.122 SD of Y = 8.873 rXY = 24.673 (3.122)(8.873) = .891
4b. Slope Formula Covariance of X & Y = 24.673 SD of X = 3.122 bXY = 24.673 (3.122)2 = 2.531
4a. Intercept Formula Mean of X (votes) = 49.42 Mean of Y (seats) = 44.81 Intercept = b0 = MeanY – bYXMeanX = 44.81 – 2.53*49.42 = -80.32
The Regression Line Seats = -80.32 + 2.53*Votes
What do we get out of a regression slope coefficient that we didn’t get out of a correlation coefficient? • Correlations are “standardized” • Slope coefficients are reported in the original metric of the dependent variable. “b” is read as “a b unit change in the dependent variable if the independent variable changes by 1 unit”.
So what do the Erikson data tell us? • Correlation “As the number of votes gained by the Democrats increase, the number of seats they win increases.” • Regression “For every 1 unit increase in the number of votes (X), the Democrats gain 2.5% more seats in the U. S. House of Representatives.”
B vs. b • There are actually two “b’s” in regression. A standardized B and an unstandardized b. • B is simply r. It’s perhaps fundamentally uninteresting in the bivariate situation. When we move to multivariate regression (regression with more than one IV) B will come to represent the effect of each variable controlling for all other IVs and will no longer equal r.
Another connection between correlation and Regression • B = r • R2 = r2 = B2