Download
1 / 1
10 likes | 162 Views
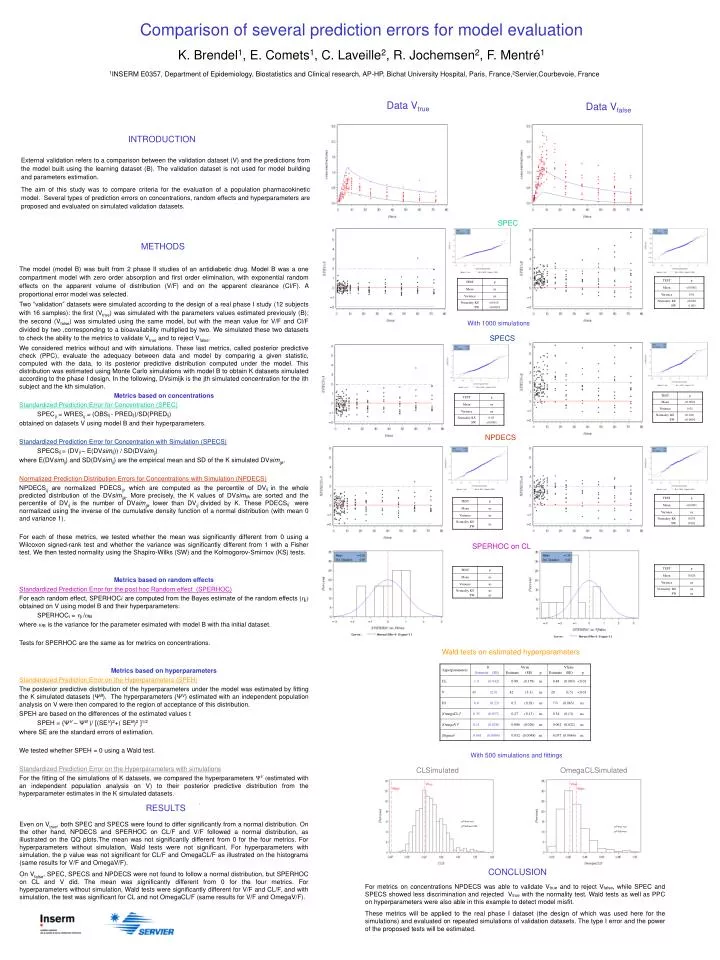
Comparison of several prediction errors for model evaluation K. Brendel 1 , E. Comets 1 , C. Laveille 2 , R. Jochemsen 2 , F. Mentré 1. 1 INSERM E0357, Department of Epidemiology, Biostatistics and Clinical research, AP-HP, Bichat University Hospital, Paris, France, 2 Servier,Courbevoie, France.

E N D
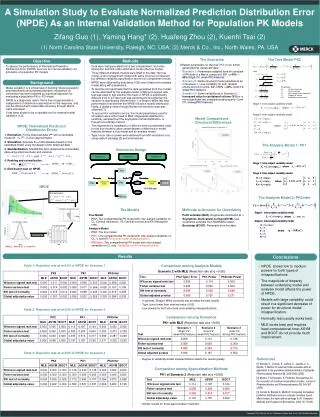
Comparison of several prediction errors for model evaluation K. Brendel1, E. Comets1, C. Laveille2, R. Jochemsen2, F. Mentré1 1INSERM E0357, Department of Epidemiology, Biostatistics and Clinical research, AP-HP, Bichat University Hospital, Paris, France,2Servier,Courbevoie, France Data Vtrue Data Vfalse INTRODUCTION External validation refers to a comparison between the validation dataset (V) and the predictions from the model built using the learning dataset (B). The validation dataset is not used for model building and parameters estimation. The aim of this study was to compare criteria for the evaluation of a population pharmacokinetic model. Several types of prediction errors on concentrations, random effects and hyperparameters are proposed and evaluated on simulated validation datasets. SPEC METHODS The model (model B) was built from 2 phase II studies of an antidiabetic drug. Model B was a one compartment model with zero order absorption and first order elimination, with exponential random effects on the apparent volume of distribution (V/F) and on the apparent clearance (Cl/F). A proportional error model was selected. Two “validation” datasets were simulated according to the design of a real phase I study (12 subjects with 16 samples): the first (Vtrue) was simulated with the parameters values estimated previously (B); the second (Vfalse) was simulated using the same model, but with the mean value for V/F and Cl/F divided by two ,corresponding to a bioavailability multiplied by two. We simulated these two datasets to check the ability to the metrics to validate Vtrueand to reject Vfalse. We considered metrics without and with simulations. These last metrics, called posterior predictive check (PPC), evaluate the adequacy between data and model by comparing a given statistic, computed with the data, to its posterior predictive distribution computed under the model. This distribution was estimated using Monte Carlo simulations with model B to obtain K datasets simulated according to the phase I design. In the following, DVsimijk is the jth simulated concentration for the ith subject and the kth simulation. Metrics based on concentrations Standardized Prediction Error for Concentration (SPEC) SPECij = WRESij = (OBSij - PREDij)/SD(PREDij) obtained on datasets V using model B and their hyperparameters. Standardized Prediction Error for Concentration with Simulation (SPECS) SPECSij= (DVij – E(DVsimij)) / SD(DVsimij) where E(DVsimij) and SD(DVsimij)are the empirical mean and SD of the K simulated DVsimijk. Normalized Prediction Distribution Errors for Concentrations with Simulation (NPDECS) NPDECSij are normalized PDECSij, which are computed as the percentile of DVijin the whole predicted distribution of the DVsimijk. More precisely, the K values of DVsimijk are sorted and the percentile of DVij is the number of DVsimijk lower than DVij divided by K. These PDECSij were normalized using the inverse of the cumulative density function of a normal distribution (with mean 0 and variance 1). For each of these metrics, we tested whether the mean was significantly different from 0 using a Wilcoxon signed-rank test and whether the variance was significantly different from 1 with a Fisher test. We then tested normality using the Shapiro-Wilks (SW) and the Kolmogorov-Smirnov (KS) tests. Metrics based on random effects Standardized Prediction Error for the post hoc Random effect (SPERHOC) For each random effect, SPERHOCi are computed from the Bayes estimate of the random effects (i) obtained on V using model B and their hyperparameters: SPERHOCi = i /B where B is the variance for the parameter esimated with model B with tha initial dataset. Tests for SPERHOC are the same as for metrics on concentrations. Metrics based on hyperparameters Standardized Prediction Error on the Hyperparameters (SPEH) The posterior predictive distribution of the hyperparameters under the model was estimated by fitting the K simulated datasets (ΨB). The hyperparameters (ΨV) estimated with an independent population analysis on V were then compared to the region of acceptance of this distribution. SPEH are based on the differences of the estimated values t SPEH = (ΨV – ΨB )/ [(SEV)2+( SEB)2 ]1/2 where SE are the standard errors of estimation. We tested whether SPEH = 0 using a Wald test. Standardized Prediction Error on the Hyperparameters with simulations For the fitting of the simulations of K datasets, we compared the hyperparameters ΨV (estimated with an independent population analysis on V) to their posterior predictive distribution from the hyperparameter estimates in the K simulated datasets. With 1000 simulations SPECS NPDECS SPERHOC on CL Wald tests on estimated hyperparameters With 500 simulations and fittings CLSimulated OmegaCLSimulated RESULTS pVtrue =ns pVfalse=0.002 Even on Vtrue, both SPEC and SPECS were found to differ significantly from a normal distribution. On the other hand, NPDECS and SPERHOC on CL/F and V/F followed a normal distribution, as illustrated on the QQ plots.The mean was not significantly different from 0 for the four metrics. For hyperparameters without simulation, Wald tests were not significant. For hyperparameters with simulation, the p value was not significant for CL/F and OmegaCL/F as illustrated on the histograms (same results for V/F and OmegaV/F). On Vfalse, SPEC, SPECS and NPDECS were not found to follow a normal distribution, but SPERHOC on CL and V did. The mean was significantly different from 0 for the four metrics. For hyperparameters without simulation, Wald tests were significantly different for V/F and CL/F, and with simulation, the test was significant for CL and not OmegaCL/F (same results for V/F and OmegaV/F). pVtrue =ns pVfalse=ns CONCLUSION For metrics on concentrations NPDECS was able to validate Vtrue and to reject Vfalse, while SPEC and SPECS showed less discrimination and rejected Vtrue with the normality test. Wald tests as well as PPC on hyperparameters were also able in this example to detect model misfit. These metrics will be applied to the real phase I dataset (the design of which was used here for the simulations) and evaluated on repeated simulations of validation datasets. The type I error and the power of the proposed tests will be estimated.