Download
1 / 1
10 likes | 287 Views
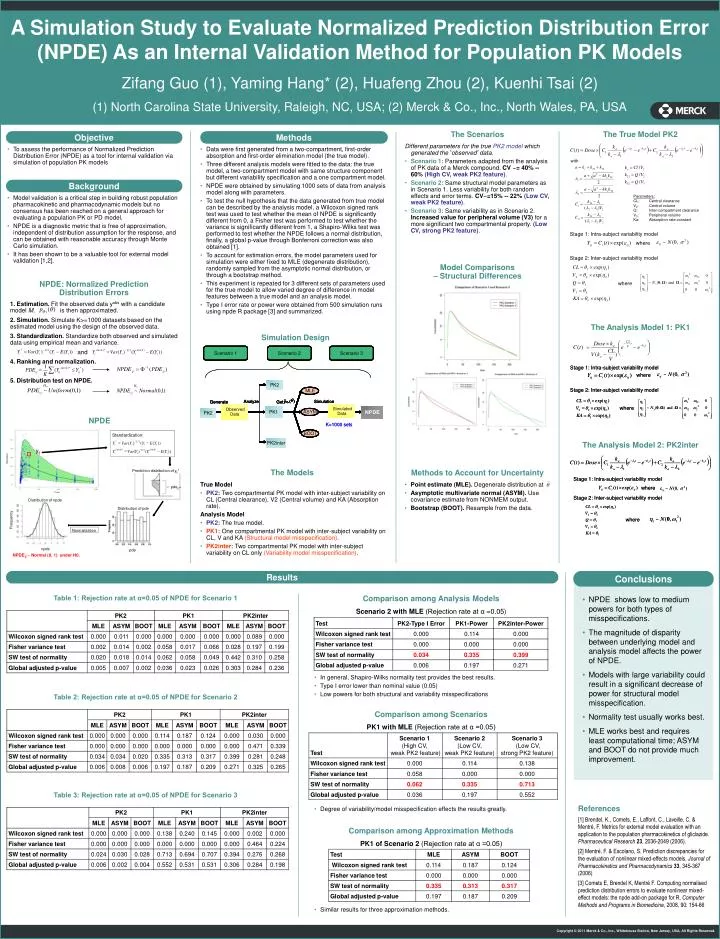
The Scenarios. The True Model PK2. Different parameters for the true PK2 model which generated the ‘ observed ’ data. Scenario 1: Parameters adapted from the analysis of PK data of a Merck compound. CV ~= 40% -- 60% (High CV, weak PK2 feature) .

E N D
The Scenarios The True Model PK2 Different parameters for the true PK2 model which generated the ‘observed’ data. • Scenario 1: Parameters adapted from the analysis of PK data of a Merck compound. CV ~= 40% -- 60% (High CV, weak PK2 feature). • Scenario 2: Same structural model parameters as in Scenario 1. Less variability for both random effects and error terms. CV~=15% -- 22% (Low CV, weak PK2 feature). • Scenario 3: Same variability as in Scenario 2. Increased value for peripheral volume (V3) for a more significant two compartmental property. (Low CV, strong PK2 feature). Model Comparisons– Structural Differences 1. Estimation. Fit the observed data yobs with a candidate model M. is then approximated. 2. Simulation. Simulate K>=1000 datasets based on the estimated model using the design of the observed data. 3. Standardization. Standardize both observed and simulated data using empirical mean and variance. and 4. Ranking and normalization. 5. Distribution test on NPDE. The Analysis Model 1: PK1 Scenario 1 Scenario 2 Scenario 3 Scenario 1 Scenario 1 Scenario 1 Scenario 2 Scenario 2 Scenario 2 Scenario 3 Scenario 3 Scenario 3 PK2 PK2 PK2 PK2 MLE q q q q q q ˆ ˆ ˆ ˆ ˆ ˆ p p p p p p ( ( ( ( ( ( ) ) ) ) ) ) Analyze Analyze Analyze Analyze Simulation Simulation Simulation Simulation Generate Generate Generate Generate Get Get Get Get q q q q q q | | | | | | y y y y y y Simulated Observed Simulated Simulated Simulated PPC & PPC & Observed Observed Observed Standardization: ASYM NPDE NPDE PK1 PK1 PK1 PK1 PK2 PK2 PK2 PK2 Data Data Data Data Data Data Data Data NPDE NPDE * - = - 1 / 2 Y Var ( Y ) ( Y E ( Y )) i i i i K=1000 sets K=1000 sets y sim ( k ) * sim ( k ) - = - 1 / 2 Y Var ( Y ) ( Y E ( Y )) ij i i i i BOOT PK2inter PK2inter PK2inter PK2inter The Analysis Model 2: PK2inter Prediction distribution of y * ij pde ij Methods to Account for Uncertainty Distribution of npde • Point estimate (MLE). Degenerate distribution at • Asymptotic multivariate normal (ASYM). Use covariance estimate from NONMEM output. • Bootstrap (BOOT). Resample from the data. Distribution of pde Normalization pde NPDE ~ Normal (0, 1) under H0. ij Conclusions A Simulation Study to Evaluate Normalized Prediction Distribution Error (NPDE) As an Internal Validation Method for Population PK Models Zifang Guo (1), Yaming Hang* (2), Huafeng Zhou (2), Kuenhi Tsai (2) (1) North Carolina State University, Raleigh, NC, USA; (2) Merck & Co., Inc., North Wales, PA, USA Objective Methods • To assess the performance of Normalized Prediction Distribution Error (NPDE) as a tool for internal validation via simulation of population PK models • Data were first generated from a two-compartment, first-order absorption and first-order elimination model (the true model). • Three different analysis models were fitted to the data: the true model, a two-compartment model with same structure component but different variability specification and a one compartment model. • NPDE were obtained by simulating 1000 sets of data from analysis model along with parameters. • To test the null hypothesis that the data generated from true model can be described by the analysis model, a Wilcoxon signed rank test was used to test whether the mean of NPDE is significantly different from 0, a Fisher test was performed to test whether the variance is significantly different from 1, a Shapiro-Wilks test was performed to test whether the NPDE follows a normal distribution, finally, a global p-value through Bonferroni correction was also obtained [1]. • To account for estimation errors, the model parameters used for simulation were either fixed to MLE (degenerate distribution), randomly sampled from the asymptotic normal distribution, or through a bootstrap method. • This experiment is repeated for 3 different sets of parameters used for the true model to allow varied degree of difference in model features between a true model and an analysis model. • Type I error rate or power were obtained from 500 simulation runs using npde R package [3] and summarized. Background • Model validation is a critical step in building robust population pharmacokinetic and pharmacodynamic models but no consensus has been reached on a general approach for evaluating a population PK or PD model. • NPDE is a diagnostic metric that is free of approximation, independent of distribution assumption for the response, and can be obtained with reasonable accuracy through Monte Carlo simulation. • It has been shown to be a valuable tool for external model validation [1,2]. NPDE: Normalized PredictionDistribution Errors Simulation Design NPDE The Models True Model • PK2: Two compartmental PK model with inter-subject variability on CL (Central clearance), V2 (Central volume) and KA (Absorption rate). Analysis Model • PK2: The true model. • PK1: One compartmental PK model with inter-subject variability on CL, V and KA (Structural model misspecification). • PK2inter: Two compartmental PK model with inter-subject variability on CL only (Variability model misspecification). Results Table 1: Rejection rate at α=0.05 of NPDE for Scenario 1 Comparison among Analysis Models • NPDE shows low to medium powers for both types of misspecifications. • The magnitude of disparity between underlying model and analysis model affects the power of NPDE. • Models with large variability could result in a significant decrease of power for structural model misspecification. • Normality test usually works best. • MLE works best and requires least computational time; ASYM and BOOT do not provide much improvement. Scenario 2 with MLE (Rejection rate at α=0.05) • In general, Shapiro-Wilks normality test provides the best results. • Type I error lower than nominal value (0.05) • Low powers for both structural and variability misspecifications Table 2: Rejection rate at α=0.05 of NPDE for Scenario 2 Comparison among Scenarios PK1 with MLE (Rejection rate at α =0.05) Table 3: Rejection rate at α=0.05 of NPDE for Scenario 3 References [1] Brendel, K., Comets, E., Laffont, C., Laveille, C. & Mentré, F. Metrics for external model evaluation with an application to the population pharmacokinetics of gliclazide. Pharmaceutical Research23, 2036-2049 (2006). [2] Mentré, F. & Escolano, S. Prediction discrepancies for the evaluation of nonlinear mixed-effects models. Journal of Pharmacokinetics and Pharmacodynamics33, 345-367 (2006) [3] Comets E, Brendel K, Mentré F. Computing normalised prediction distribution errors to evaluate nonlinear mixed-effect models: the npde add-on package for R, Computer Methods and Programs in Biomedicine, 2008, 90: 154-66 • Degree of variability/model misspecification effects the results greatly. Comparison among Approximation Methods PK1 of Scenario 2 (Rejection rate at α =0.05) • Similar results for three approximation methods.