Download

1 / 96
960 likes | 965 Views
Comparison of Several Multivariate Means. Shyh-Kang Jeng Department of Electrical Engineering/ Graduate Institute of Communication/ Graduate Institute of Networking and Multimedia. Paired Comparisons. Measurements are recorded under different sets of conditions

E N D
Comparison of Several Multivariate Means Shyh-Kang Jeng Department of Electrical Engineering/ Graduate Institute of Communication/ Graduate Institute of Networking and Multimedia
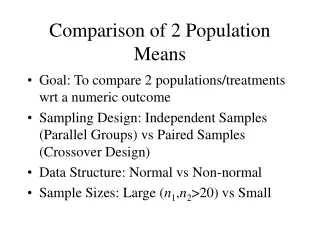
Paired Comparisons • Measurements are recorded under different sets of conditions • See if the responses differ significantly over these sets • Two or more treatments can be administered to the same or similar experimental units • Compare responses to assess the effects of the treatments
Experiment Design for Paired Comparisons 1 2 3 n . . . . . . Treatments 1 and 2 assigned at random Treatments 1 and 2 assigned at random Treatments 1 and 2 assigned at random Treatments 1 and 2 assigned at random
Repeated Measures Design for Comparing Measurements • q treatments are compared with respect to a single response variable • Each subject or experimental unit receives each treatment once over successive periods of time
3 4 2 1 Example 6.2: Treatments in an Anesthetics Experiment • 19 dogs were initially given the drug pentobarbitol followed by four treatments Present Halothane Absent Low High CO2 pressure
Test for Equality of Treatments in a Repeated Measures Design
Comparing Mean Vectors from Two Populations • Populations: Sets of experiment settings • Without explicitly controlling for unit-to-unit variability, as in the paired comparison case • Experimental units are randomly assigned to populations • Applicable to a more general collection of experimental units
Example 6.4: Electrical Usage of Homeowners with and without ACs
Example 6.4: Electrical Usage of Homeowners with and without ACs
Example 6.9: Nursing Home Data • Nursing homes can be classified by the owners: private (271), non-profit (138), government (107) • Costs: nursing labor, dietary labor, plant operation and maintenance labor, housekeeping and laundry labor • To investigate the effects of ownership on costs