Download

1 / 20
210 likes | 602 Views
Splines Model for Prediction of House Prices . David Boniface – UCL . Aim To create a web-based facility for customers to enter address of a house and obtain graph showing trend of price of house since last sold, extrapolated to current date.

E N D
Splines Model for Prediction of House Prices David Boniface – UCL
Aim To create a web-based facility for customers to enter address of a house and obtain graph showing trend of price of house since last sold, extrapolated to current date.
UK Land Registry of house sale prices was available monthly from 2000. Properties were categorised as new-build or not, and Detached, Semi-detached, Terraced or Flats. Only detached houses model implemented.
Initial plan was to model prices of houses in the vicinity of the target house in real time and hence estimate current price. The next slide shows the sale prices of 18 nearest houses to a target house last sold in August 2006 for £485k.
18 nearest houses to Target House £485,000 18/08/2006 in TN16 1RP
Linear regression was used to give a prediction for current date using as predictors date and distance from target house. Predictions compared with known recent sale prices Problems: 1: To get 50 houses sold in the relevant time period could require including houses a great distance away. 2: Predictions were out by as much as £100k. 3: Too much variability.
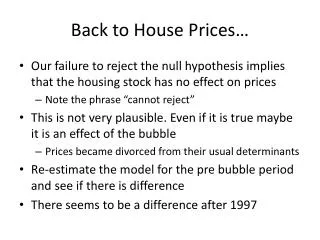
Great Price Crash of 2008-2009 From autumn 2008 the great price crash began. This ruled out linear models. New strategy required. Decided to model the national price trend and apply this to the last known sale price of a target house.
The Stata ado ‘uvrs’ (with user specified knots) was used to model the national price curve. The parameter estimates were saved. Later, to respond in real time to a query about a particular house, ‘splinegen’ was used to generate the spline curve of mean prices for the required time span to current date. This was applied to target house.
1. Use of coded date Dates from Land Registry, in Excel, are in days from 01 Jan1900 In Stata, a %td date value is in days from 01Jan1960 Hence conversion of current date code from Stata to Excel format is by the following syntax: replace date = date(c(current_date),"DMY") + 60*365 + 16 creturn: c(current_date) * This returns the current date
2. Choice of user knots for splines (days since 1900) uvrs regress priceln date, knots(37000 38000 39000 39600 40000) noorthog
3. Saving and retrieving the knots uvrs regress priceln date, knots(37000 38000 39000 39600 40000) file open myfile using makeglobals.do, write replace file write myfile "global knots `e(knots)'" _n file write myfile "global bknots `e(bknots)'" _n file close myfile This creates a do-file for later use containing commands that create global macros containing the knot values. This next syntax recreates the globals with required values: do makeglobals splinegen date $knots, bknots($bknots) i.e. splinegen date 37000 38000 39000 39600 40000, bknots(36529 40200)
3. Saving and retrieving the parameter estimates estimates save "uvrs3" This creates a binary file for later use containing coefficients etc This next syntax retrieves the values: splinegen date $knots, bknots($bknots) estimates use "uvrs3" predict yhatln
4. Use of log scale to deal with skewed price distribution gen lndelta = 150000 gen priceln = ln((price + lndelta)/100) Inverse transform applied before plotting: gen national_price = 100*exp(yhatln)-lndelta Has effect of scaling up price rises of more expensive houses - similar to applying a % increase.
5. Estimation of prediction intervals 95% confidence intervals based on estimated standard errors from the model. These were large: typically ±£60,000
6. The 2008/2009 slump in house prices This caused considerable difficulties for the project since the picture was continually changing. The modelling struggled to keep up with the evolving situation which resulted in the project being abandoned.
Limitations Beyond the range of data only a linear spline is used. This may not be ideal for prediction We had insufficient information to account for the price of a house – hence too much unexplained variability. The trial and error process for selection of knots is not appropriate – automatic process required,
Acknowledgements Dan Winchester of Labworks who funded the work Patrick Royston, MRC Clinical Trials Unit, London, who provided modified versions of uvrs and splinegen Kristin MacDonald of StataCorp who helped with globals