Download
1 / 31
670 likes | 1.18k Views
Plasma Diagnostics. Monday Afternoon Tutorial for UC-DISCOVERY Major Program Award on Feature Level Compensation and Control Eray S. Aydil Chemical Engineering Department University of California Santa Barbara 12/01/2003. Externally controlled variables. Figures of merit

E N D
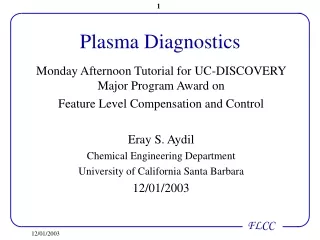
Plasma Diagnostics Monday Afternoon Tutorial for UC-DISCOVERY Major Program Award on Feature Level Compensation and Control Eray S. Aydil Chemical Engineering Department University of California Santa Barbara 12/01/2003
Externally controlled variables Figures of merit (process outcome) pressure, gas flow rate and composition, rf power, rf-bias power, wafer temperature etch rate, anisotropy selectivity, uniformity, reproducibility Central Problem in Plasma Etching • To understand how externally controlled variables affect the process outcome through the internal plasma parameters. Internal plasma parameters ion flux, J+ radical fluxes, Gi ion energy, E • Plasma diagnostics are experimental methods based on various electrical and spectroscopic techniques that allow the measurement of internal plasma parameters.
+ + Ion and etchant fluxes impinging on the wafer surface determines the etch rates and profile evolution in plasma etching processes. • ER = f (J+, E, Gi, T) • Example: SF6/O2 etching of Si ER = f (J+, E, GF, GO, T) • Would like to measure or estimate J+, E, GF, GO Passivating oxide layer
I I=Iesat V Vp I=Iionsat Vf Langmuir Probes www.hidenanalytical.com www.staldertechnologies.com
On Wafer Ion Flux Probe Measurements • Probe mounted on 8” heavily doped Si wafer. • Probe biased at ~ -70 V with respect to the Si wafer • Ion current determined by measuring the voltage drop across a known resistance. • Both reference and measurement probe are isolated from ground using a floating power supply. • Plasma sees the same surfaces during etching of a wafer. • Probe and reference are etched but measurement is not affected. Heavily Doped Conducting Si wafer Measurement Probe R rf filter Bias Voltage V Si Kapton
Ion flux measurements in SF6/O2 plasmas • Measurements were done in plasmas containing SF6, O2, HBr, Cl2, NF3 and probe worked well for extended periods of time. I-V probe ion flux probe
Measuring radical concentrations in a plasma Line of Sight Appearance Ionization Mass Spectrometry Time, Cost, Footprint Laser Induced Fluorescence UV Absorption IR Absorption Optical Emission Spectroscopy with Actinometry Accuracy
Optical Emission Spectroscopy $ 25 K Imaging Spectrographs with CCDs $ 10 K Monochromator & PMT Cost Integrated spectrographs and data acquisition $ 3 K Photodiode and narrow pass filter $ 0.5 K 10 1 0.1 Resolution, nm
Optical Emission u hn e- ground state • Emission intensity depends on nx, ne and Te • Emission intensity is not a measure of X concentration
Optical Emission Actinometry J. Coburn and M. Chen, J. Appl. Phys.51, 3134(1980).
Actinometry Requirements • Excitation to the emitting states of X and actinometer (e.g., Ar) must have similar magnitude cross sections and thresholds. • sex, X sex, Ar then a is a weak f(Te). • sex, X sex, Ar then a is f(Te) which must be determined. • Emitting state must only be populated by electron impact excitation of the ground state.
mm Example: Use of OES and ion flux measurements in SF6/O2 etching of Si 10 mT 25 mT 40 mT 75 mT • Etch rate has a maximum at some intermediate pressure (~25 mTorr). 800W TCP/-20 V rf-bias/40 SF6/40 O2/150 sec
Example: Absolute measurements of Cl and Cl2 concentrations in Cl2 plasma Donnelly, J. Vac. Sci. Technol. A 14, 1076 (1996)Malyshev, Donnelly, Kornblit, and Ciampa, J. Appl. Phys. 84, 137 (1998) Ullal, Singh, Daugherty, Vahedi and AydilJ. Vac. Sci. Technol. A20, 1195 (2002). • A number of emission lines for Cl2, Cl and Ar studied for suitability (Donnelly, et al.) • 305 nm Cl2 emission (Eth = 8.4 or 9.2 eV) • 822 nm Cl emission (Eth = 10.5 eV) • 750.4 nm Ar emission (Eth = 13.5 eV) • The Ar emitting state has unusually low s for excitation from Arm but threshold does not match the Cl2 or Cl thresholds • a must be corrected for Te dependence
From emission intensities to absolute concentrations • In the limit power 0; dissociation 0 nCl2 ng = Pg/kBTg • Repeat zero-power extrapolation at different pressures to determine aCl2 (Te) • Determine Cl concentration by mass balance or • Use nCl at single point to determine aCl,Ar P = 10 mTorr, no wafer, Q = 100 sccm Cl2
Studying the Effect of Walls on the Cl2 Dissociation Using OES and Actinometry • SiO2 covered walls: low Cl sticking probability g~0.03 • Alumina reactor walls: high Cl sticking probability g~1
Mass Spectrometry http://www.mcb.mcgill.ca/~hallett/GEP/PLecture1/MassSpe_files/image011.gif
Line of Sight Threshold Ionization Mass Spectrometry Threshold ionization can be used for detecting ALL radicals in a plasma Density of radicals is obtained at the substrate plane Principle of TIMS O + e O+ + 2e : 13.6 eV (E1) O2 + e O+ + O + 2e : 19.0 eV (E2) Since E1 > E2, an electron energy scan can differentiate the two products E2-E1 is typically equal to the bond energy of the bond that is broken during dissociative ionization
Dissociation on the ionizer filament also produces radicals which must be distinguished from the radicals in the beam extracted from the plasma Molecules are thermally dissociated on the filament and ionized resulting in a spurious background signal.
25-200 mTorr ~10-5 Torr ~10-9 Torr ~10-7 Torr
Beam-to-Background Ratio Pure O2: Beam-to-background ratio 3.2 at 25 mTorr and 2.0 at 200 mTorr. For radicals, the beam-to-background ratio will depend on the sticking probability of the radical.
O atom detection in O2 plasma O + e O+ + 2e : 13.6 eV O2 + e O+ + O + 2e : 19.0 eV m/e = 16
O in the beam = Signal w/chopper open – Signal w/chopper closed O + e O+ + 2e : 13.6 eV O2 + e O+ + O + 2e : 19.0 eV
Quantifying the Mass Spectrometer signal where, S : QMS signal in c/s a : product of m/e-ratio dependent factors Ie : electron current of the ionizer s : cross-section of the ionization process nionizer: number density of neutrals in the ionizer (nbeam+ nbackground)
Calibration • CH4 (m/e =16) is used for calibration. • QMS signal for CH4 is measured for a known pressure of the gas in the plasma chamber under plasma-off condition • CH4 calibration must be done right after the O concentration measurements to avoid the effect of drifts in the SEM sensitivity Singh, Coburn, and Graves, JVST A 17, 2447 (1999). Singh, Coburn, and Graves, JVST A 18, 299 (2000). Agarwal, Quax, van de Sanden, Maroudas and Aydil, JVST A 22, in press (2004). Agarwal, Hoex, van de Sanden, Maroudas and Aydil, Appl. Phys. Lett, in press (2003).
Example: N2* (metastable A3Su+state) and N concentrations in N2 plasma N2* + e N2+ + 2e : 9.4 eV (??) N2 + e N2+ + 2e : 15.6 eV In plasma assisted MBE of GaN, N2* may be preferred over N as the nitrogen precursor. Can N2* be detected and absolute concentrations of N and N2* measured?
Probable Franck-Condon Transitions Transition ‘a’: ~11 eV Transition ‘b’: ~12 eV Transition ‘c’: ~14 eV
Summary • Simultaneous with the emergence of plasma processing as an enabling technology, a variety of plasma diagnostic methods have been developed over the last two decades to measure internal plasma properties. • Ion current probe • OES and actinometry • Line of sight threshold ionization mass spectrometry • Ease of implementation range from methods that take ~days-week to “Ph.D. lifetime.” • To save time and money the first ask “What do we want to measure and how accurately do we want to measure it?” • Measurement of radical concentrations over the wafer and ion flux impinging on its surface help in process development and improve fundamental understanding of etching and deposition processes.
Acknowledgements • Sumit Agarwal (now @ University of Massachusetts) • Jun Belen (UCSB) • Dr. Sergi Gomez (UCSB) • Bram Hoex (now @ Eindhoven Univ. of Technology) • Guido Quax (now @ Eindhoven Univ. of Technology) • Saurabh Ullal (now Lam Research Corporation)