Download
1 / 44
490 likes | 637 Views
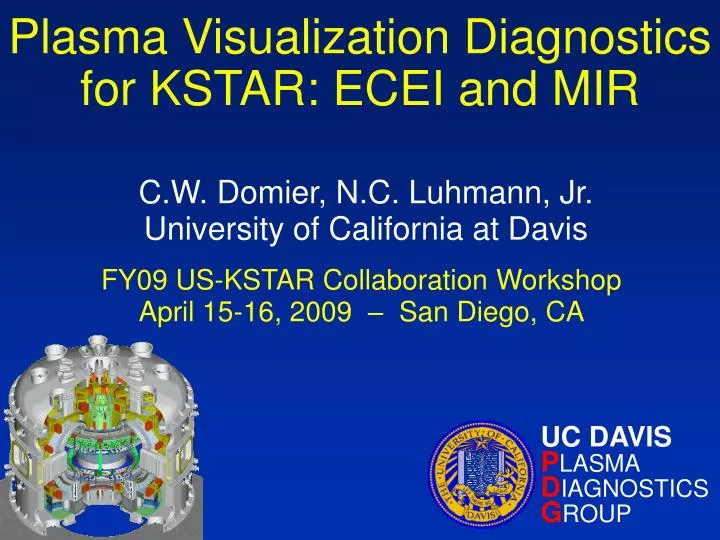
Plasma Visualization Diagnostics for KSTAR: ECEI and MIR. C.W. Domier, N.C. Luhmann, Jr. University of California at Davis FY09 US-KSTAR Collaboration Workshop April 15-16, 2009 – San Diego, CA. UC DAVIS P LASMA D IAGNOSTICS G ROUP. Outline. Introduction and Overview

E N D
Plasma Visualization Diagnostics for KSTAR: ECEI and MIR C.W. Domier, N.C. Luhmann, Jr.University of California at Davis FY09 US-KSTAR Collaboration WorkshopApril 15-16, 2009 – San Diego, CA UC DAVIS PLASMA DIAGNOSTICS GROUP
Outline • Introduction and Overview • Diagnostic Principles • Te Measurements via ECEI • ne Measurements via MIR and MDIR • Experience on Previous and Current Systems • Ongoing Development Activities • Low Field (~2 T) and High Field (3-3.5 T) Conceptual Designs • Diagnostic Development Plan
Outline • Introduction and Overview • Diagnostic Principles • Te Measurements via ECEI • ne Measurements via MIR and MDIR • Experience on Previous and Current Systems • Ongoing Development Activities • Low Field (~2 T) and High Field (3-3.5 T) Conceptual Designs • Diagnostic Development Plan
Introduction and Motivation • A unique window of opportunity exists on KSTAR for fundamental understanding of MHD and turbulence not possible with ITER and future burning plasma experiments • Excellent port access • Advances in 3-D simulation capability • Advances in imaging diagnostics capability • 2-D plasma microwave imaging tools • Electron Cyclotron Emission Imaging (ECEI) • Microwave Imaging Reflectometry(MIR) • Microwave Doppler Imaging Reflectometry (MDIR)
Outline • Introduction and Overview • Diagnostic Principles • Te Measurements via ECEI • ne Measurements via MIR and MDIR • Experience on Previous and Current Systems • Ongoing Development Activities • Low Field (~2 T) and High Field (3-3.5 T) Conceptual Designs • Diagnostic Development Plan
2-D ECE Imaging (ECEI) fce • In conventional 1-D ECE radiometry, a single antenna receives all frequencies. In ECEI, a vertically aligned antenna/ mixer array is employed as the receiver. • Advantages: high spatialand temporal resolution,2-D correlation. • Real time 2-D imaging using wideband IF electronics and single sideband detection. • 16×8=128 channels on ASDEX-UG • 20×16=320 channels onDIII-D • 24×32=768 channels envisaged for KSTAR R fce R
ECEI System Overview – TEXTOR LO Antennas LO1 Plasma IF Amps Optics Detectors Baluns ADCs Mixers Preamps Filters VideoAmps Power Divider LOn Notch Filter Dichroic Plate Mixers
Imaging Fluctuation Reflectometry • Microwave reflections from plasma cutoffs contain information on density fluctuations near the cutoff layer • 1-D fluctuations: simple mirror-like interpretation • 2-D fluctuations: the received signal is corrupted by interference from multiple reflected waves • Imaging can restore phase fronts! 1-D fluctuations 2-D fluctuations
Microwave Imaging Reflectometry (MIR) • Probing beam illuminates extended region of cutoff layer • Beam curvature matched (toroidal and poloidal) to that of the cutoff surface • Cutoff layer imaged onto array of detectors (3 elements shown), eliminating interference effects • Detection system shares the same plasma-facing optics
MIR System Overview - TEXTOR MIR Array LOSource Toriodal Mirror Plasma Beam Splitter Illumination Source MIR Electronics Window Poloidal Mirror Mixer I-Q Mixer IF Amp DACs Antenna Filters Optics Plasma Video Amps LO
Microwave Doppler Imaging Reflectometry • Off-axis probing beam is scattered by Doppler rotation of fluctuations near the cutoff layer • Optics angularly resolve the reflected/scattered waves onto imaging array Ray tracing of Doppler reflectometry system on Tore-Supra
Comparison Between MIR and MDIR MIR • Common features • Planar imaging array • Large aperture optics • Multiple frequencies to probe multiple cutoff layers • Major differences • MDIR illumination beamis narrower, and tilted with respect to plasma midplane • MDIR probes poloidal scattering angle rather than vertical position MDIR
Outline • Introduction and Overview • Diagnostic Principles • Te Measurements via ECEI • ne Measurements via MIR and MDIR • Experience on Previous and Current Systems • Ongoing Development Activities • Low Field (~2 T) and High Field (3-3.5 T) Conceptual Designs • Diagnostic Development Plan
Single Array ECEI on TEXTOR Single array implementation with 16×8 Te image resolution
TEXTOR Study of “Sawtooth Oscillation” ECEI demonstrated “random 3-D reconnection zone,” in which the reconnection zone has been observed to occur everywhere (including high field side, see video left)
Single Array ECEI on ASDEX-UG TEXTOR system transferred to ASDEX-UG in Jan. 2009, and will begin operation in May 2009
Dual Array ECEI on DIII-D Horizontal and vertical zoom control with full remote capability Two array system, each 20×8 channels expandable to 20×24 Installation in Sept. 2009, with first results in Oct. 2009 1.3 m Narrow zoom Narrow spacing 27 cm
Dual Array ECEI on DIII-D Horizontal and vertical zoom control with full remote capability Two array system, each 20×8 channels expandable to 20×24 Installation in Sept. 2009, with first results in Oct. 2009 1.3 m Wide zoom Wide spacing 55 cm
Dual Array ECEI on DIII-D Horizontal and vertical zoom control with full remote capability Two array system, each 20×8 channels expandable to 20×24 Installation in Sept. 2009, with first results in Oct. 2009 1.3 m Wide zoom Wide spacing 55 cm
Outline • Introduction and Overview • Diagnostic Principles • Te Measurements via ECEI • ne Measurements via MIR and MDIR • Experience on Previous and Current Systems • Ongoing Development Activities • Low Field (~2 T) and High Field (3-3.5 T) Conceptual Designs • Diagnostic Development Plan
Ongoing Development Activities • Mini-lens imaging array concept and vertical zoom optics • Horizontal zoom ECEI electronics and frequency extenders • Quasi-optical notch filters • High frequency imaging antennas • Multi-frequency MIR sources
Mini-Lens Array Configuration Advantages Elliptical substrate lens optimizes coupling and reduces sidelobes Eliminates off-axis aberrations Uses front side LO pumping for enhanced coupling, increased sensitivity and wide bandwidth (octave) operation Mini-Lenses Antennas Beam Splitter LO Beam
New Mini-Lens ECEI System Optics Notch Filters (3) LO Source ECEI Array Beamsplitter Focal Plane Translation Lens Zoom Control Lenses
New Vertical Zoom Optics Narrow Zoom Shot 107809 Wide Zoom Shot 107808 Te images courtesy of Prof. T. Munsat at the University of Colorado
Mixer VCO VCO 3.4 GHz 2.5 GHz LP Filter 4.0 GHz 3.4 GHz 4.3 GHz 4.6 GHz Digital Attenuator 5.2 GHz 5.2 GHz Power Divider 6.1 GHz 5.8 GHz HP Filter 7.0 GHz 6.4 GHz 7.9 GHz 7.0 GHz 8.8 GHz 7.6 GHz New Horizontal Zoom Electronics Horizontal spacing and spot size can now be independently and remotely-controlled
Multiple Modules for Increased Coverage Standardized modules can be ganged together to extend RF coverage • Two modules provide16 GHz coverage • Three modules provide24.5 GHz coverage
New “Stackable” Notch Filters • Highly collimated mini-lens beams permit significantly improved ECRH shielding • Relaxed angular requirements (≤ 8°) • Stack up to 3 notch filters in series • 140 GHz filter stack installed on TEXTOR (single filter results shown below) • 170 GHz filter stack under development for KSTAR Quasi-Optical Notch Filters Quasi-Optical Notch Filters
Antennas/Mixers for High-Field ECEI fLO fLO≈ ½fRF • Two approaches under investigation to realize imaging antennas for ECEI on KSTAR under high-field (3-3.5 T) conditions • Fundamental mixers require high frequency (150-220 GHz) sources with >40 mW output power difficult to obtain! • 2nd harmonic mixers have 2-3 dB worse conversion losses, but can use lower frequency (75-110 GHz) sources readily available! fIF = fRF - fLO fRF fIF = fRF - 2fLO fRF Fundamental Mixer 2nd Harmonic Mixer
TEXTOR MIR system now set up at POSTECH for detailed laboratory measurements and characterization POSTECH Collaboration (Prof. Hyeon Park) on MIR Characterization
2-D simulations of microwaves reflected from a circular plasma, with an illumination beam curvature-matched to the plasma PPPL Collaboration (Dr. Gerrit Kramer) on MIR Modelling
Kyungpook National University Collaboration (Prof. Kangwook Kim) on MIR Illumination Sources Schematic illustrating how a simultaneous “comb” of illumination frequencies can probe multiple cutoff layers, as each frequency reflects from a distinct cutoff layer
Kyungpook National University Collaboration (Prof. Kangwook Kim) on MIR Illumination Sources
Outline • Introduction and Overview • Diagnostic Principles • Te Measurements via ECEI • ne Measurements via MIR and MDIR • Experience on Previous and Current Systems • Ongoing Development Activities • Low Field (~2 T) and High Field (3-3.5 T) Conceptual Designs • Diagnostic Development Plan
ECEI Configuration: ~2T Focal lenses • Low field (~2 T) design for ECEI only • High field side (HFS) and low field side (LFS) systems share the same zoom optics (inside cassette) • Two array configuration per port, each generating 24(v)×8(h) Te images expandable to 24×24 images Zoom lenses HFS array Mirror Toroidal lenses Plasma Cassette Vacuum window LFS array Beam splitter
ECEI on KSTAR at 2.0 T 100 cm 33 cm High Field Side Low Field Side
ECEI on KSTAR at 2.0 T 100 cm 33 cm High Field Side Low Field Side
ECEI on KSTAR at 2.0 T 100 cm 51 cm High Field Side Low Field Side
ECEI/MIR Configuration: 3-3.5 T Focal lenses Zoom lenses MIR array MIR Source • High field design for simultaneous ECEI and MIR/MDIR • Two array ECEI configuration, each generating 24×8 Te images expandable to 24×24 images • Single array MIR/MDIR configuration with a 16 element array and up to 8 simultaneous frequencies/cutoff layers • Decision to implement MIR or MDIR (or both) dependent upon results from joint POSTECH and PPPL study into MIR physics Beamsplitter Toroidal lenses Plasma Cassette Vacuum window ECEI array Dichroic Plate
ECEI at High Field (3-3.5 T) 100 cm 51 cm High Field Side Low Field Side
MIR/MDIR at High Field (3-3.5 T) 100 cm 20 cm
Outline • Introduction and Overview • Diagnostic Principles • Te Measurements via ECEI • ne Measurements via MIR and MDIR • Experience on Previous and Current Systems • Ongoing Development Activities • Low Field (~2 T) and High Field (3-3.5 T) Conceptual Designs • Diagnostic Development Plan
Diagnostic Development Plan FY2009 • Design multi-array low field (~2 T) ECEI system • Develop multi-frequency source technology for MIR/MDIR (collaboration with Kyungpook National University) • Fabricate and test high performance 170 GHz notch filters FY2010 • Fabricate and characterize multi-array low-field ECEI system • Install multi-array low-field ECEI system on KSTAR • Fabricate and test prototype high-field (3.0-3.5 T) ECEI antennas • POSTECH and PPPL to complete MIR system tests; results to be used to design optimum MIR and/or MDIR optical configuration FY2011 • Operate and maintain low-field ECEI system on KSTAR • Design high field (3-3.5 T) simultaneous ECEI and MIR/MDIR system