Download
1 / 19
190 likes | 298 Views
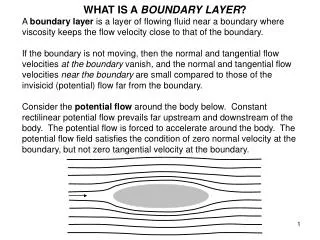
A synthesis of published VOCALS studies on marine boundary layer and cloud structure along 20S. Chris Bretherton Department of Atmospheric Sciences University of Washington. VOCALS RF05, 72W 20S. Work summarized. Pre-REx Rahn and Garreaud, ACP, 10, 4491–4519, 2010 (Parts 1&2)

E N D
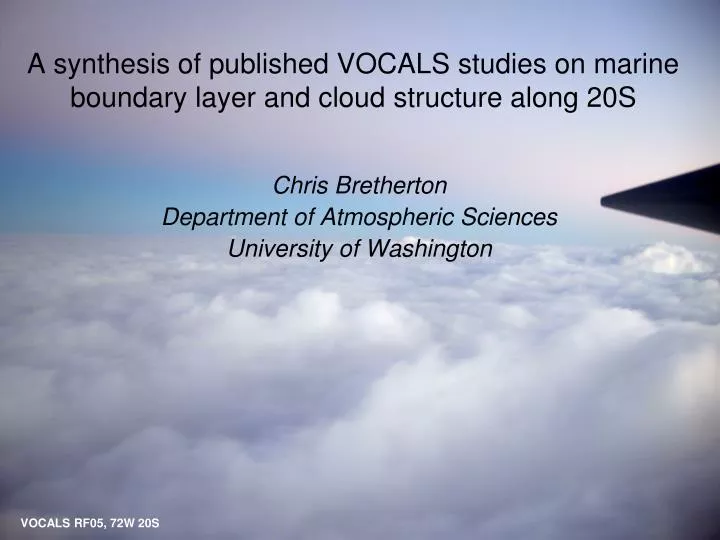
A synthesis of published VOCALS studies on marine boundary layer and cloud structure along 20S Chris Bretherton Department of Atmospheric Sciences University of Washington VOCALS RF05, 72W 20S
Work summarized • Pre-REx • Rahn and Garreaud, ACP, 10, 4491–4519, 2010 (Parts 1&2) • Bretherton et al., ACP 2010 • Abel, Walters, Allen, ACP, 10, 10541–10559, 2010 • Jones, Breth, Leon, ACPD, 11, 8431-8460, 2011 Note: This is not comprehensive! Other relevant papers show interesting data analysis along 20S, esp. using Ron Brown data. 20S MBL/cloud structure studies support the VOCALS aerosol/cloud/precipitation theme and the modeling program
hourly cloud base hourly cloud top hourly LCL EPIC 2001 85 W 20S Comstock et al. 2005 -60 -40 -20 0 15 dBZ Key Pre-REx findings • Significant drizzle at 85W (Bretherton et al. 2004) • Strong diurnal cycle of cloud thickness affected by Andean upsidence wave (Garreaud and Munoz 2004)
More CCN/cloud droplets near coast (Tomlinson et al. 2007; Wood et al. 2008) • Boundary layer deeper offshore (Serpetzloglou et al. 2008; Zuidema et al. 2009) Wood et al. 2008 Rahn and Garreaud 2010
REx 20S measurements • Comprehensively document structure of CTBL and lower troposphere along 20S - vertical structure, microphysics &/drizzle, aerosols & chemistry, radiation, turbulence. • Use multiplatform observations (C130, BAe146, Twin Otter aircraft, Ron Brown ship, Iquique soundings). • Repeat often enough to obtain a climatologically representative data set for comparison with climate models.
Monthly-mean T, q profiles Weighted average of C130, 146 dropsonde, Brown, Iquique 10K inversion: sharp, ~ 1000 m at coast ~ 1600 m at 85W Free trop warmer near S Amer coast PBL well-mixed to 80W, more decoupled in ‘remote’ 80-85W zone Free trop moist near coast but very dry offshore
Leg wind comparisons with NCEP, ECMWF Good agreement with operational analyses, even above boundary layer NCEP reanalysis is much worse, and a poor choice for trajectories
Cloud droplet conc. lon-time section: Aircraft vs. MODIS • Excellent sampling • Aircraft measurements consistent with satellite estimates where cf > 0.8. • Nd decreases westward from ~250 cm-3 near coast to ~100 cm-3 at 85W
WCR/WCL cross-section for C130 RF03 Bretherton et al. 2010 • Mesoscale drizzle cells ubiquitous west of 75W • Cloud base coincident with 150 m LCL (well-mixed) near the coast. Rahn and Garreaud 2010, Part II C130 REx WCR cloud-top heights are a good test for forecast models.
PBL decoupling Max cld thickness Zinv – LCL > 500 m • Macrophysics drives regional cloud structure contrasts: Deeper inversion decoupled, deeper Cu more drizzle. aerosols Bretherton et al. 2010 Jones et al. 2011
Precipitation rate estimates • In cloud 2DC and radar Z-R rainrate estimates consistent • Much more drizzle offshore (thicker clouds, lower Nd) • Most rain evaporates above surface • Near-surface Z-R rainrates less than 2DC - why?
Turbulence –useful comparison to models? • Subcloud turbulence same in all longitude zones • In-cloud turbulence strengthens to the west (thicker, deeper clouds, more longwave cooling)
The diurnal cycle along 20S Ron Brown sondes show diurnal upsidence wave is phased later at 85W (top) than 75W (bottom).
GOES IR-based cloud fraction on 20S is a useful model comparison
Key new REx 20S insights • Cloud macrophysics (the typically deeper and more decoupled PBL offshore) affects cloud optical properties and precipitation at least as strongly as aerosol gradients. Deep PBL high LWP cells, decoupling precipitation • There are extensive regions of unbroken Sc which (like POCs) are decoupled and drizzling, yet maintain droplet concentrations of 60-100 cm-3 much higher than in POCs. • In-situ cloud droplet conc. agrees with satellite estimates if the Sc cloud cover is not too broken. • Winds from NCEP/ECMWF operational analyses agree with aircraft measurements suitable for trajectory analysis. REx has produced a comprehensive set of 20S physical/chemical measurements distilled and gridded for model comparison. How best to package it?
Conclusions • 20S dataset provides an unprecedented integrated cross-section of boundary-layer structure, clouds and aerosols across mean gradients within a stratocumulus regime • Clouds get cleaner, deeper, rainier, more decoupled , more turbulent further to the west. • NCEP and ECMWF (but not NCEP reanalysis) winds are accurate enough for trajectory analysis in this region. • Satellite microphysical retrievals (if appropriately restricted to nearly solid low cloud) agree well with in-situ REx observations.
20S IR strip charts (0845 UTC) 20S airborne obs cover a representative range of cloud conditions B412 B410 RF07 RF14 B420 RF13 RF05 RF04 B417 RF03 RF10 RF02 B414 RF09
20S back-trajectories 75W: Directional variability above inversion; Coastal contact in PBL 85W: Consistent SE flow, stronger in PBL. 850 hPa trajectories: 0-75 hPa/d subsidence; generally weaker when flow is more easterly. Rhea George [Back 2 days from mid-time of C130 flights]
Radar stats: Median cloud top, cloud base and LCL Nearshore Remote Transitional Inversion deepens, Sc thickens, more decoupling further west