Download

1 / 22
220 likes | 223 Views
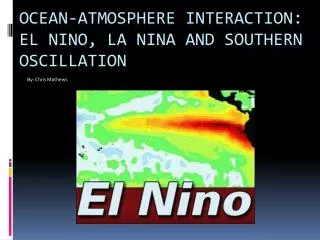
This study examines the predictability of the mean location of typhoon formation in a seasonal prediction experiment using a coupled general circulation model. The experiment focuses on the role of basin-wide Indian Ocean on atmospheric fields in the western North Pacific, particularly the SST warming in the Indian Ocean after El Nino.

E N D
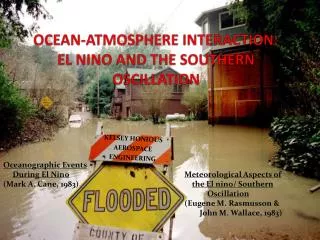
Air-sea interaction over the Indian Ocean after El Nino in JMA/MRI-CGCM seasonal forecast experiment Tamaki Yasuda(tyasuda@mri-jma.go.jp) Meteorological Research Institute Japan Meteorological Agency with Yuhei Takaya (JMA),Yosuke Fujii, Satoshi Matsumoto, Toshiyuki Nakaegawa, Masafumi Kamachi, and Tomoaki Ose (MRI)
Predictability of the mean location of Typhoon formation in a seasonal prediction experiment with a coupled general circulation model Takaya, Y., T. Yasuda, T. Ose, and T. Nakaegawa Journal of Meteorological Society of Japan, 2010, 88, 799-812.
Mean Latitude of TC Formation Best Track N Forecast 60% range (6 members of 10) S Cor : 0.68 Reference : RMSC Tokyo Best Track Region : 0-40N, 100E-180 Period : Jun.-Oct. Correlation : 0.68 (1979-2006)
Mean Longitude of TC Formation Best Track E Forecast 60% range (6 members of 10) W Cor : 0.53 Reference : RMSC Tokyo Best Track Region : 0-40N, 100E-180 Period : Jun.-Oct. Correlation : 0.53 (1979-2006)
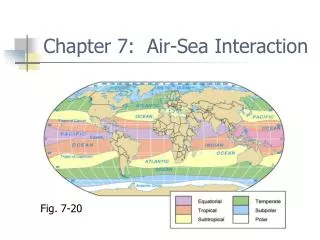
1. Introduction JJA Forecast skill of seasonal forecast experiment by JMA/MRI-CGCM Initial: end of April Initial: end of January Sea level Pressure Precipitation
Role of basin-wide Indian Ocean on atmospheric fields in the western North Pacific - SST warming in the Indian Ocean after El Nino (Klein et al. 1999, Xie et al. 2002, Lau and Nath 2003, Ohba and Ueda 2005, Du et al. 2009) - Zonal SST gradient between Pacific and Indian Ocean (Ohba and Ueda 2006) - Indian Ocean Capacitor effect (Xie et al. 2009, Chowdary et al. 2010) Lag regression with NINO3.4SST(NDJ) troposphere temp. surface wind rainfall This study - Processes on SST warming in the Indian Ocean after El Nino - JMA/MRI-CGCM seasonal forecast experiment Xie et al. (2009)
Correlation with JJA NIOSSTin seasonal forecast experiment NIO: North Indian Ocean (40-100E, 0-20N) Initial: end of April Initial: end of January SLP (shaded) & Surface Wind Precipitation (shaded) & Troposphere temperature (contour) NIOSST influences atmospheric pattern in JJA.
2. Seasonal forecast experiment in JMA/MRI-CGCM WCRP/WGSIPClimate-system Historical Forecast Project (CHFP) JMA/MRI-CGCM - Now used as operational seasonal forecast system at JMA. - AGCM: JMA unified AGCM. Resolution: TL95L40 - OGCM: Meteorological Research Institute Community Ocean Model (MRI.COM; Ishikawa et al. 2005) ・OGCM domain: 75S-75N (prescribed sea ice climatology) ・Resolution: 1deg(lon) x 0.3-1deg(lat), vertical: 50 levels - Air-sea coupling time interval: 1hour - Monthly mean momentum and heat flux corrections Experiment - 7-month forecast (10 member) -1979-2006 - 00Z and 12Z in the last 5days of Jan, Apr., Jul., and Oct. Initial condition - atmosphere: JRA25/JCDAS(Onogi et al. 2007) - ocean: Meteorological Research Institute Ocean Assimilation System (MOVE-G/MRI.COM; Usui et al. 2006)
3. Prediction Skill for SST Anomaly Correlation RMSE
Prediction skill for SST in the three key regions Nino3.4 (190-60W, 5S-5N) Tropical Indian Ocean (TIO) (40-100E, 20S-20N) North Indian Ocean (NIO) (40-100E, 0-20N) lead time (month)
Anomaly Correlation Nino3.4 Tropical Indian Ocean (TIO) North Indian Ocean (NIO) This study: Focus on the experiments started from end of January
4. SST Relationship between ENSO and Indian Ocean Lag correlation with Nino3.4SST(NDJ) ●Nino3.4SST thin: Observed (COBE-SST) Bold: JMA/MRI-CGCM ○TIOSST +NIOSST El Nino Mature phase Lag regression of zonal mean SST with NINO3.4SST(NDJ) Observed JMA/MRI-CGCM 0.1 0.2 0.1
5. Warming in the South Indian Ocean during boreal winter and spring Lag regression with NINO3.4SST(NDJ) Observed (COBE-SST, MOVE-G, JRA25) Wind stress & Wind stress curl SST Z20(20℃depth) Net Surface Heat Flux CI=5m CI=0.1℃ CI=4W/m2 CI=10-8N/m3 Feb. Mar. Apr. Easterly anomly along Eq. and Anticyclonic WSC anomaly SST warming in the South Indian Oceam Z20 anomaly and Westward propagation (Xie et al. 2002, Du et al. 2009)
Lag regression with NINO3.4SST(NDJ) JMA/MRI-CGCM Wind stress & Wind stress curl SST Z20 Net Surface Heat Flux CI=5m CI=0.1℃ CI=4W/m2 CI=10-8N/m3 Feb. Mar. Apr. Easterly anomly along Eq. and Anticyclonic WSC anomaly SST warming in the South Indian Oceam Z20 anomaly and westward propagation consistent with observation
10S Z20 (20℃ depth)climatology(contour: CI=20m) Standard deviation (shaded) JMA/MRI-CGCM Observed Feb. Mar. (m)
Lag regressions along 10S with NINO3.4SST(NDJ) JMA/MRI-CGCM Observed SST CI=0.1℃ Z20 CI=4m SST CI=0.1℃ Z20 CI=4m El Nino Mature Phase Net Surface Heat Flux CI=4W/m2 Ekman pumping CI=4x10⁻⁷m/s Net Surface Heat Flux CI=4W/m2 Ekman pumping CI=10-7m/s El Nino Mature Phase
Rag regression of temperature zonal section along 10S with NINO3.4SST(NDJ) depth (m) depth (m) JMA/MRI-CGCM Observed C.I.=0.5℃ Green: monthly mean temperature climatology
Correlation between Z20 and SST along 10S JMA/MRI-CGCM Observation Shaded:95%confidential SST Warming in the South Indian Ocean during boreal winter and spring Change in the Walker circulation associated with El Nino Easterly wind anomaly along the equatorial Indian Ocean (IO) ↓ Anticyclonic WSC anomaly in the southeastern IO Generation and westward propagation of thermocline depth anomaly ↓ Thermocline dome in the western IO Deepening of thermocline and related weakening of upwelling ↓ SST warming in the southern IO
Short Wave Radiation Latent Heat Flux (CI=2W/m2) anomaly anomaly 6. SST warming in the North Indian Ocean during boreal spring and summer Lag regression with NINO3.4SST(NDJ) Observed Wind stress & Wind stress curl SST Z20 Net Surface Heat Flux (CI=5m) (CI=0.1℃) (CI=4W/m2) (CI=10-8N/m3) Feb WES feedback (Kawamura et al. 2001) MA - - Summer Monsoon (Du et al. 2009) MJ + + JA
Short Wave Radiation Latent Heat Flux (CI=2W/m2) Positive WSCA anomaly Lag regression with NINO3.4SST(NDJ) JMA/MRI-CGCM Wind stress & Wind stress curl SST Z20 Net Surface Heat Flux (CI=5m) (CI=0.1℃) (CI=4W/m2) (CI=10-8N/m3) Feb No WES feedback MA Summer Monsoon MJ JA
8. Summary - SST warming in the Indian Ocean after El Nino in the seasonal forecast experiment of JMA/MRI-CGCM have been examined. - SST warming in the South Indian Ocean during boreal spring in CGCM is due to deeper thermocline anomaly induced by positive wind stress curl anomaly. However, area (period) of interaction between thermocline and SST is wider (longer) than observation. - In boreal spring, predicted wind anomaly does not induce WES feedback that prevent SST warming in the western North Indian Ocean in the observation. This is a reason for higher correlation between NIOSST and NINO3.4SST(NDJ) than that in the observation. - Wind anomaly in boreal summer tend to weaken summer monsoon in the western North Indian Ocean. This reduces latent heat release to the atmosphere, maintaining positive SST anomaly in North Indian Ocean. - These results are consistent with studies based on the observation. This could be one of causes that we got good forecast skill in the western North Pacific in boreal summer.
Tropical Indian Ocean (TIO) North Indian Ocean (NIO)