Download

1 / 10
100 likes | 172 Views
A Look at Means, Variances, Standard Deviations, and z -Scores. Dr. Margie Mason College of William and Mary mmmaso@wm.edu. Algebra SOL A.10. The student will compare and contrast multiple univariate data sets, using box-and-whisker plots. Algebra SOL A.10.

E N D
A Look at Means, Variances, Standard Deviations, and z-Scores Dr. Margie Mason College of William and Mary mmmaso@wm.edu
AlgebraSOL A.10 The student will compare and contrast multiple univariate data sets, using box-and-whisker plots.
Algebra SOL A.10 Let’s use unifix stick heights of 5 6 8 8 10 13 15 17 18 20
Determining a Box-and-Whisker Plot Find: Median – the middle value when arranged from smallest to largest. 11.5 Lower extreme (LE) – the smallest value 5 Upper extreme (UE) – the largest value 20 Lower quartile (LQ) – the value halfway between the lower extreme and the median. 8 Upper quartile (UQ) – the value halfway between the upper extreme and the median. 17 Interquartile range (IQR) – The difference between the upper quartile and the lower quartile. 9
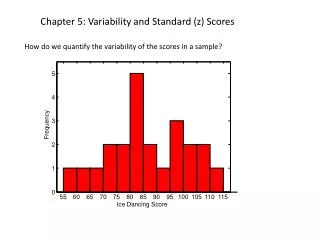
Determining a Box-and-Whisker Plot Determine and draw the scale. Subtract the smallest value from the largest value to determine the range. Choose a reasonable size for the intervals based on the range to be covered, e.g., 1, 2, 5, or 10. Draw the scale much like a number line at the bottom of your plot.
Determining a Box-and-Whisker Plot 3. Draw the box: a. Length of the box extends for LQ to UQ. It is drawn above the scale. b. Mark the median. c. Width of box can be anything.
Determining a Box-and-Whisker Plot 4. Draw the whiskers: a. Draw from the box you just drew to LE and UE.
Determining a Box-and-Whisker Plot Alternate method for drawing the whiskers: 4. Determine the outliers: Multiply the IQR by 1.5 and add this number to the UQ and subtract it from the LQ. Any values outside these limits are outliers.
Determining a Box-and-Whisker Plot Alternate Method: 5. Draw whiskers: a. Draw from box to LE and UE excluding outliers. b. Place asterisks on any outliers.
Determining a Box-and-Whisker Plot How many years of experience as a teacher do you have?