Download
1 / 31
310 likes | 381 Views
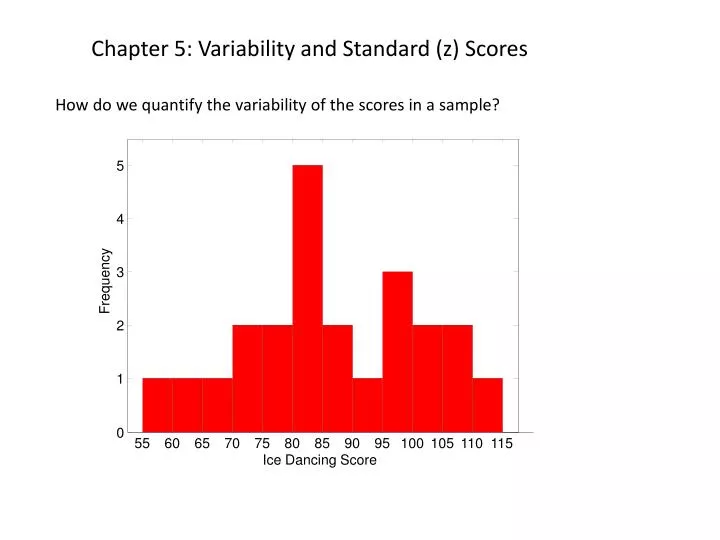
Chapter 5: Variability and Standard (z) Scores . How do we quantify the variability of the scores in a sample?. 5. 4. 3. Frequency. 2. 1. 0. 55. 60. 65. 70. 75. 80. 85. 90. 95. 100. 105. 110. 115. Ice Dancing Score.

E N D
Chapter 5: Variability and Standard (z) Scores How do we quantify the variability of the scores in a sample? 5 4 3 Frequency 2 1 0 55 60 65 70 75 80 85 90 95 100 105 110 115 Ice Dancing Score
Method 1: range: difference between the highest and lowest scores Example: The range of ice dancing scores is 111.15-59.64 = 51.51 points The range is easy to calculate, but it really only depends on two scores. So it’s not a very informative or reliable measure of variability. Ice Dancing , compulsory dance scores, Winter Olympics
Method 2: The semi-interquartile range (Q): One half of the distance between P75 and P25. Percentile rank Score Q1 = P25 Q3 = P75 Example: ice dancing scores Ice Dancing , compulsory dance scores, Winter Olympics
Method 3: Variance: the mean of the squares of the deviation scores deviation score: The difference between a score and the mean of the scores Sums of squared deviation scores Formula for variance of a population of scores Formula for variance of a sample of scores
Example: find the variance of this sample of 7 numbers: 5,3,1,6,2,8,3
Calculating variance this way can be tedious. Fortunately there’s a shortcut for calculating SSx: Sum of squared deviations from the mean Sum of squares Sum squared divided by n
Example: calculate the variance of this sample of 10 numbers: 8 6 3 7 1 7 7 8 9 10 X X2 n =
standard deviation: the square root of the variance Formula for standard deviation for a population of scores Formula for standard deviation for a sample of scores The standard deviation has the same units as the original scores (e.g. points, inches, etc.)
Warning! Point of future confusion! The definition of variance and standard deviation has an (or N) in the denominator. Later when we get in to inferential statistics, we’ll start dividing by n-1: The first definition is the true average of the squared deviance from the mean. But this number a biased estimate of the variance of the population. Divide by ‘n’ when you just want the standard deviation of our sample (or population). Divide by ‘n-1’ when you want to estimate the standard deviation of the population.
Example: calculate the standard deviation of this sample of 10 numbers: 8 6 3 7 1 7 7 8 9 10 X X2 n =
Example: calculate the standard deviation of this sample of 20 numbers: X X2 n =
Fun facts about the standard deviation: Adding a constant to each number in a sample does not change the standard deviation (or variance) SX+b = SX Multiplying each number in a sample by a constant multiplies the standard deviation by that same constant. SaX = aSX
How big is a standard deviation? For a normal (bell-shaped) distribution: 68.2% of the values fall within one standard deviation of the mean 95.4% of the values fall within two standard deviations of the mean 99.7% of the values fall within three standard deviations of the mean 1 standard deviation above and below the mean is where the bend of the curve switches (the ‘inflection point’)
Standard Scores (z scores) Sometimes it is useful to compare scores across distributions that have different means and standard deviations. A common way to do this is to convert the scores into standard deviation units, or ‘z scores’. The goal is to modify all of the scores so that the new mean is equal to zero, and the new standard deviation equal to one. To make the new mean zero, we subtract the mean from all scores. Remember this shifts the mean but doesn’t change the standard deviation. To make the new standard deviation equal to 1, we divide all scores by the standard deviation. This would normally change the mean, but since it’s zero, it doesn’t change. Here’s the formula for changing a sample of scores, X to z:
Example: Convert the following ten scores to z scores Step 1, calculate the mean and standard deviation: n = X X2
Example: Convert the following ten scores to z scores Step 2, for each score, subtract the mean and divide by the standard deviation X Check for yourself that the mean of z is 0, and the standard deviation is 1.
Z-transforming your scores doesn’t affect the shape of the distribution. Mean= 80, s.d. = 33.0 Mean= 0, s.d. = 1 100 100 80 80 60 60 40 40 20 20 0 0 0 50 100 150 -2 -1 0 1 2 3 Score z score
The standard normal distribution Relative frequency -4 -3 -2 -1 0 1 2 3 4 z score The standard normal distribution is a continuous distribution. It has a mean of 0 and a standard deviation of 1 The total area under the curve is equal to 1
area =0.3413 -3 -2 -1 0 1 2 3 z Table A (page 436) gives you the proportion of scores for given ranges in the standard normal Column 2 Area between 0 and z Column 3 Area above z area =0.1587 -3 -2 -1 0 1 2 3 z