Download
1 / 55
550 likes | 554 Views
Today: Standard Deviations & Z-Scores. Any questions from last time?. Homework #2 (Due 9/7). Chapters 3, 4, 5 – Central Tendency, Variability, and the Z Transformation CH 3: 4, 5, 13, 14, 24, 27 CH 4: 1, 7, 8, 17, 22, 24, 25, 28 CH 5: 2, 3, 8, 9, 18, 20, 24, 25, 28

E N D
Today: Standard Deviations & Z-Scores Any questions from last time?
Homework #2 (Due 9/7) • Chapters 3, 4, 5 – Central Tendency, Variability, and the Z Transformation • CH 3: 4, 5, 13, 14, 24, 27 • CH 4: 1, 7, 8, 17, 22, 24, 25, 28 • CH 5: 2, 3, 8, 9, 18, 20, 24, 25, 28 • SPSS: Find the mean and population standard deviation of the variables Height and ShoeSize using the file 34011data.sav. Create z-transformed versions of both variables & save them to the file. Email your files (data and output) to the instructor (abmeyer@ilstu.edu).
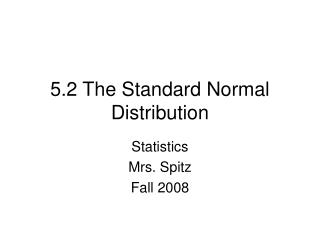
Topics for today • Measures of Variability • Standard Deviation & Variance (Population) • Standard Deviation & Variance (Samples) • Effects of linear transformations on mean and standard deviation • The Z transformation Skip to slide 14
Describing distributions Distributions are typically described with three properties: • Shape: unimodal, symmetric, skewed, etc. • Center: mean, median, mode • Spread (variability): standard deviation, variance
Variability of a distribution Variability provides a quantitative measure of the degree to which scores in a distribution are spread out or clustered together. • In other words variabilility refers to the degree of “differentness” of the scores in the distribution. High variability means that the scores differ by a lot Low variability means that the scores are all similar
μ Standard deviation The standard deviation is the most commonly used measure of variability. • The standard deviation measures how far off all of the scores in the distribution are from the mean of the distribution. • Essentially, the average of the deviations.
-3 1 2 3 4 5 6 7 8 9 10 μ Computing standard deviation (population) Step 1: To get a measure of the deviation we need to subtract the population mean from every individual in our distribution. Our population 2, 4, 6, 8 X - μ = deviation scores 2 - 5 = -3
-1 1 2 3 4 5 6 7 8 9 10 μ Computing standard deviation (population) Step 1: To get a measure of the deviation we need to subtract the population mean from every individual in our distribution. Our population 2, 4, 6, 8 X - μ = deviation scores 2 - 5 = -3 4 - 5 = -1
1 1 2 3 4 5 6 7 8 9 10 μ Computing standard deviation (population) Step 1: To get a measure of the deviation we need to subtract the population mean from every individual in our distribution. Our population 2, 4, 6, 8 X - μ = deviation scores 2 - 5 = -3 6 - 5 = +1 4 - 5 = -1
3 1 2 3 4 5 6 7 8 9 10 μ Computing standard deviation (population) Step 1: Compute the deviation scores: Subtract the population mean from every score in the distribution. Our population 2, 4, 6, 8 X - μ = deviation scores 2 - 5 = -3 6 - 5 = +1 Notice that if you add up all of the deviations they must equal 0. 4 - 5 = -1 8 - 5 = +3
X -μ= deviation scores 2 - 5 = -3 6 - 5 = +1 4 - 5 = -1 8 - 5 = +3 Computing standard deviation (population) Step 2: Get rid of the negative signs. Square the deviations and add them together to compute the sum of the squared deviations (SS). SS = Σ (X - μ)2 = (-3)2 + (-1)2 + (+1)2 + (+3)2 = 9 + 1 + 1 + 9 = 20
Computing standard deviation (population) Step 3: Compute the Variance (the average of the squared deviations) • Divide by the number of individuals in the population. variance = σ2 = SS/N
standard deviation = σ = Computing standard deviation (population) Step 4: Compute the standard deviation. Take the square root of the population variance.
Computing standard deviation (population) • To review: • Step 1: compute deviation scores • Step 2: compute the SS • SS = Σ (X - μ)2 • Step 3: determine the variance • take the average of the squared deviations • divide the SS by the N • Step 4: determine the standard deviation • take the square root of the variance
Any questions about these symbols: • SS Self-monitor your understanding • We are about to learn how to calculate sample standard deviations. • Before we move on, any questions about how to calculate population standard deviations? • Any questions about these terms: • deviation scores • squared deviations • sum of squares • Variance • standard deviation
Computing standard deviation (sample) The basic procedure is the same. • Step 1: compute deviation scores • Step 2: compute the SS • Step 3: determine the variance • This step is different • Step 4: determine the standard deviation
Our sample 2, 4, 6, 8 1 2 3 4 5 6 7 8 9 10 M Computing standard deviation (sample) Step 1: Compute the deviation scores • subtract the sample mean from every individual in our distribution. X - M = Deviation Score 2 - 5 = -3 6 - 5 = +1 4 - 5 = -1 8 - 5 = +3
2 - 5 = -3 6 - 5 = +1 4 - 5 = -1 8 - 5 = +3 Computing standard deviation (sample) Step 2: Determine the sum of the squared deviations (SS). SS = Σ (X - M)2 X - M = deviation scores = (-3)2 + (-1)2 + (+1)2 + (+3)2 = 9 + 1 + 1 + 9 = 20 Apart from notational differences the procedure is the same as before
3 X X X X 2 1 4 μ Computing standard deviation (sample) Step 3: Determine the variance Recall: Population variance = σ2 = SS/N The variability of the samples is typically smaller than the population’s variability
Sample variance = s2 Computing standard deviation (sample) Step 3: Determine the variance Recall: Population variance = σ2 = SS/N The variability of the samples is typically smaller than the population’s variability To correct for this we divide by (n-1) instead of just n
Computing standard deviation (sample) Step 4: Determine the standard deviation standard deviation = s =
Self-monitor your understanding • Next, we’ll find out how changing our scores (adding, subtracting, multiplying, dividing) affects the mean and standard deviation. • Before we move on, any questions about the sample standard deviation? • About why we divide by (n-1)? • About the following symbols: • s2 • s
Changes the total and the number of scores, this will change the mean and the standard deviation Properties of means and standard deviations Change/add/delete a given score Mean Standard deviation changes changes
All of the scores change by the same constant. M old Properties of means and standard deviations Change/add/delete a given score Mean Standard deviation changes changes Add/subtract a constant to each score
All of the scores change by the same constant. M old Properties of means and standard deviations Change/add/delete a given score Mean Standard deviation changes changes Add/subtract a constant to each score
All of the scores change by the same constant. M old Properties of means and standard deviations Change/add/delete a given score Mean Standard deviation changes changes Add/subtract a constant to each score
All of the scores change by the same constant. M old Properties of means and standard deviations Change/add/delete a given score Mean Standard deviation changes changes Add/subtract a constant to each score
All of the scores change by the same constant. • But so does the mean M new Properties of means and standard deviations Change/add/delete a given score Mean Standard deviation changes changes Add/subtract a constant to each score changes
It is as if you just pick up the distribution and move it over, but the spread (variability) stays the same M old Properties of means and standard deviations Change/add/delete a given score Mean Standard deviation changes changes Add/subtract a constant to each score changes
It is as if you just pick up the distribution and move it over, but the spread (variability) stays the same M old Properties of means and standard deviations Change/add/delete a given score Mean Standard deviation changes changes Add/subtract a constant to each score changes
It is as if you just pick up the distribution and move it over, but the spread (variability) stays the same M old Properties of means and standard deviations Change/add/delete a given score Mean Standard deviation changes changes Add/subtract a constant to each score changes
It is as if you just pick up the distribution and move it over, but the spread (variability) stays the same M old Properties of means and standard deviations Change/add/delete a given score Mean Standard deviation changes changes Add/subtract a constant to each score changes
It is as if you just pick up the distribution and move it over, but the spread (variability) stays the same M old Properties of means and standard deviations Change/add/delete a given score Mean Standard deviation changes changes Add/subtract a constant to each score changes
It is as if you just pick up the distribution and move it over, but the spread (variability) stays the same M old Properties of means and standard deviations Change/add/delete a given score Mean Standard deviation changes changes Add/subtract a constant to each score changes
It is as if you just pick up the distribution and move it over, but the spread (variability) stays the same M old Properties of means and standard deviations Change/add/delete a given score Mean Standard deviation changes changes Add/subtract a constant to each score changes
It is as if you just pick up the distribution and move it over, but the spread (variability) stays the same M old Properties of means and standard deviations Change/add/delete a given score Mean Standard deviation changes changes Add/subtract a constant to each score changes No change M new
20 21 22 23 24 Properties of means and standard deviations Change/add/delete a given score Mean Standard deviation changes changes Add/subtract a constant to each score changes No change Multiply/divide a constant to each score (-1)2 21 - 22 = -1 23 - 22 = +1 (+1)2 s = M
Multiply scores by 2 40 42 44 46 48 Properties of means and standard deviations Change/add/delete a given score Mean Standard deviation changes changes Add/subtract a constant to each score changes No change Multiply/divide a constant to each score changes changes (-2)2 42 - 44 = -2 46 - 44 = +2 (+2)2 Sold=1.41 s = M
Self-monitor your understanding • Next, we’ll find out how to convert our scores to z-scores. • Before we move on, any questions about how changing our scores (by adding, subtracting, multiplying, or dividing by a constant) changes the mean and standard deviation?
The Z transformation If you know the mean and standard deviation of a distribution, you can convert a given score into a Z score or standard score. This score is informative because it tells you where that score falls relative to other scores in the distribution.
Locating a score • Where is our raw score within the distribution? • The natural choice of reference is the mean (since it is usually easy to find). • So we’ll subtract the mean from the score (find the deviation score). • The direction will be given to us by the negative or positive sign on the deviation score • The distance is the value of the deviation score
Reference point Direction Locating a score X1 - 100= +62 X1 = 162 X2 = 57 X2 - 100= -43
Reference point Below Above Locating a score X1 - 100= +62 X1 = 162 X2 = 57 X2 - 100= -43
Raw score Population mean Population standard deviation Transforming a score • The distance is the value of the deviation score • However, this distance is measured with the units of measurement of the score (such as inches, ounces, likert rating, etc). • Convert the score to a standard (neutral) score. In this case a z-score.
X1 - 100= +1.20 50 X2 - 100= -0.86 50 Transforming scores • A z-score specifies the precise location of each X value within a distribution. • Direction: The sign of the z-score (+ or -) signifies whether the score is above the mean or below the mean. • Distance: The numerical value of the z-score specifies the distance from the mean by counting the number of standard deviations between X and μ. X1 = 162 X2 = 57
Transforming a distribution • We can transform all of the scores in a distribution • We can transform any & all observations to z-scores if we know the distribution mean and standard deviation. • We call this transformed distribution a standardized distribution. • Standardized distributions are used to make dissimilar distributions comparable. • e.g., your height and weight • One of the most common standardized distributions is the Z-distribution.
transformation 50 150 µ µ Xmean = 100 Properties of the z-score distribution = 0
transformation +1 m m X+1std = 150 Properties of the z-score distribution 50 150 = 0 Xmean = 100 = +1
transformation -1 m m X-1std = 50 Properties of the z-score distribution 50 150 +1 = 0 Xmean = 100 = +1 X+1std = 150 = -1
Properties of the z-score distribution • Shape - the shape of the z-score distribution will be exactly the same as the original distribution of raw scores. Every score stays in the exact same position relative to every other score in the distribution. • Mean - when raw scores are transformed into z-scores, the mean will always = 0. • The standard deviation - when any distribution of raw scores is transformed into z-scores the standard deviation will always = 1.