Download
1 / 20
220 likes | 350 Views
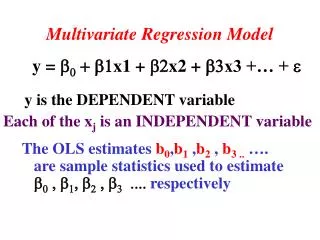
Multivariate Regression Analysis. Multivariate Regression Partial Regression Coefficients Variable Selection and Modeling Standardized Regression Coefficients T-tests. Theoretical Specification of Multivariate Regression. Number of Fire Deaths. Y. X 2. Number of Fire Trucks. X 1.

E N D
Multivariate Regression Analysis • Multivariate Regression • Partial Regression Coefficients • Variable Selection and Modeling • Standardized Regression Coefficients • T-tests
Number of Fire Deaths Y X2 Number of Fire Trucks X1 Size of Fire Partial Effects The problem of spurious relations... In an experimental design, we could fully control for such “spurious relationships”. We have to manage them statistically.
Statistical Calculation of Partial Effects In calculating the effect of X1 on Y, we need to remove The effect of the other X’s on both X1 and Y: Y “cleaned” of the effect of X2 X1 “cleaned” of the effect of X2 What this does is “clean” both Y and X1 of their correlations with X2, by using the residuals.
Predicting Student Test Scores with Average Income and Expenditures • Dependent: test scores (testscr) • Independent • Average income (avginc) • Expenditures per student (expn_stu) • Student/teacher ratio: (str) • Control: school size (enrl_tot) What would you hypothesize the effects of the independent variables to be?
Partial Regression Coefficients Predicting student test scores using expenditures per student, average income, school size, and student teacher ratios
Average income predicts expenditures; and student teacher rations are strongly correlated with per-student expenditures Predicting Expenditures per Student with Other X’s
Y X2 X1 Intuitive View of the Three Variable Case The idea of “fixed X’s” is evident here
Variable Selection(or Model Building) • Use theory and prior research • Use your hypotheses • But what if you don’t have much theoretical guidance? • Parsimony=f(simplicity, fit) • Using R2… fit, controlling for complexity
Empirical Indicators in Model Building • When adding a variable, check for: • Improved prediction (increase in adj R2) • Statistically and substantively significant estimated coefficients • Stability of model coefficients • Do other coefficients change when adding the new one? • Particularly look for sign changes
Risks in Model Building • Including irrelevant X’s • Increases complexity • Reduces adjusted R2 • Increases model variability across samples • Omitting relevant X’s • Fails to capture fit • Can bias other estimated coefficients • Where omitted X is related to both other X’s and to the dependent variable (Y)
More Risks:Samples Can Mislead • Remember: we are using sample data • About 5% of the time, our sample will include random observations of X’s that result in b’s that meet classical hypothesis tests • Or the b’s may be important, but the sample data will randomly include observations of X that do not meet the statistical tests • That’s why we rely on theory, prior hypotheses, and replication
Standardized Regression Coefficients • Variables are standardized as follows: • Result is: all variables have same mean and sX. • Standardized regression coefficients are those we’d get if we regress a standardized Y onto standardized X’s
Interpreting Standardized Betas • The standard deviation change in Y for a one-standard deviation change in X • All X’s on a equal footing • within a sample, can compare the strength of the effects of the X’s (using the “beta” command) • Not useful for comparisons across samples • Variances will differ across samples
Multiple Regression T-tests • T-tests are dependent on estimated standard errors of the b’s: • This residual captures all the independent variation in Xi. • The bigger RSSK, the smaller SEbK • The smaller SEbK, the less model “noise”
Next Time... • Confidence Intervals • F-tests • Multicolinearity • The EVILS of Step-wise regression • Interaction Effects • Intercept Dummies • Slope Dummies