Download
1 / 50
520 likes | 703 Views
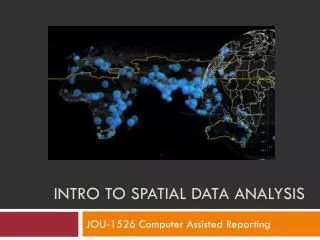
Introduction to Spatial Data Analysis in the Social Sciences. RSOC597A: Special Topics in Methods/Statistics Kathy Brasier Penn State University June 14, 2005. Session Objectives. Understand why spatial data analysis is important Identify types of questions for which SDA is relevant

E N D
Introduction to Spatial Data Analysis in the Social Sciences RSOC597A: Special Topics in Methods/Statistics Kathy Brasier Penn State University June 14, 2005
Session Objectives • Understand why spatial data analysis is important • Identify types of questions for which SDA is relevant • Gain basic knowledge of the concepts, statistics, and methods of SDA • Identify some important issues and decision points within SDA • Learn about some resources for doing spatial data analysis (software, web sites, books, etc.) • Avoid getting lost in equations!
Why Do Spatial Analysis? “Everything is related to everything else, but closer things more so.” (attributed to Tobler)
Examples • Is your educational level likely to be similar to your neighbor’s? • Are farm practices likely to be similar on neighboring farms? • Are housing values likely to be similar in nearby developments? • Do nearby neighborhoods have similar burglary rates?
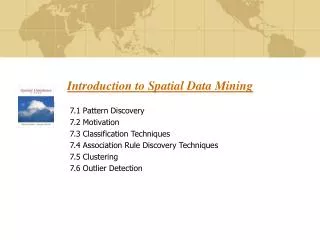
What Is Spatial Data? • 4 main types • event data, spatially continuous data, zonal data, spatial interaction data • Most frequently used in social sciences is zonal data • Data aggregated to a set of areal units (counties, MSAs, census blocks, ZIP codes, watersheds, etc.) • Variables measured over the set of units • Examples: Census, REIS, County and City Databook, etc.
What is Spatial Data Analysis? “The analysis of data on some process operating in space, where methods are sought to describe or explain the behavior of this process and its possible relationship to other spatial phenomena.” Bailey and Gatrell (1995:7) Objective of spatial data analysis: to understand the spatial arrangement of variable values, detect patterns, and examine relationships among variables
Why Do Spatial Data Analysis? • To learn more about what you’re studying • To avoid specification problems (missing variables, measurement error) • To ensure satisfaction of statistical assumptions • To be cool! To go crazy! To learn more about statistics than you ever wanted or thought possible! • To learn the limitations of statistics
Theoretical Reasons for Spatial Analysis • It tells us something more about what we’re studying • Is there an unmeasured process that affects the phenomenon? • Does this process manifest itself in space? • Examples: interaction processes, diffusion, historical or ethnic legacy, programmatic effects
Statistical Reasons for Spatial Analysis • Violation of regression assumptions • Units of analysis might not be independent • Parameter estimates are inefficient • Estimated error variance is downwardly biased, which inflates the observed R2 values • If spatial effects are present, and you don’t account for them, your model is not accurate!
Examples of Research Using SDA • Epidemiology (environmental exposure research) • Criminology (crime patterns) • Education (neighborhood effects on attainment) • Diffusion/adoption (technologies) • Social movements (trade unions, demonstrations) • Market analysis (housing and land price variation) • Spillover effects (economic spillovers of universities) • Regional studies (regional income variation & inequality) • Demography (segregation patterns) • Political science (election studies)
When do you need to do SDA? • Is there a theoretical reason to suspect differences across space? • Differences in phenomena (variable values) • Differences in relationships between phenomena (covariances) • Are you using data with spatial referent? • If yes to both, it is a good idea to at least explore any potential spatial effects • Exploration will tell you more about the subject you’re studying
Spatial Independence • Null hypothesis (H0) • Any event has an equal probability of occurring at any position in the region • Position of any event is independent of the position of any other • Implicit assumption of much work in social sciences
Spatial Effects • Test Hypothesis (H1) • Probability of an event occurring not equal for each location within region • Position of any one event dependent on position of any other event • Methods and statistics of SDA test this hypothesis • If supported, can tell us more about what we’re studying; can improve our models • If not supported, we know that we have satisfied assumptions
First Order Spatial Effects • Non-uniform distribution of observations over space • Large-scale variation in mean across the spatial units • Values of the variables are not independent of their spatial location • Results from interaction of unique characteristics of the units and their spatial location • Ex: magnets and iron filings (Bailey & Gatrell) • Referred to as spatial heterogeneity
Causes of Spatial Heterogeneity • Patterns of social interaction that create unique characteristics of spatial units • Spatial regimes: legacies of regional core-periphery relationships => differences between units (pop, econ dvpt, etc.) • Differences in physical features of spatial units • Size of counties • Combination: • Differences in topography of units => different patterns of economic development (extractive industries)
County Homicide Rates 1990 First order effects?
Second Order Spatial Effects • Localized covariation among means (or other statistics) within the region • Tendency for means to ‘follow’ each other in space • Results in clusters of similar values • Ex: magnets and iron filings (Bailey & Gatrell) • Referred to as spatial dependence (spatial autocorrelation)
Causes of Spatial Dependence • Underlying socio-economic process has led to clustered distribution of variable values • Grouping processes • grouping of similar people in localized areas • Spatial interaction processes • people near each other more likely to interact, share • Diffusion processes • Neighbors learn from each other • Dispersal processes • People move, but tend to be short distances, take their knowledge with them • Spatial hierarchies • Economic influences that bind people together • Mis-match of process and spatial units • Counties vs retail trade zones • Census block groups vs neighborhood networks
County Homicide Rates 1990 Second order effects?
So now that I’ve convinced you that spatial data analysis is an important consideration…. What Do We Do About It?
Goals of SDA • To identify spatial effects and their causes • To appropriately measure spatial effects • To incorporate spatial effects into models • To improve our knowledge of the process and how it occurs over space • All of these goals require both theory and methods
Exploratory Spatial Data Analysis • Start with questions about your theory and data: • Are there likely to be spatial processes at work (diffusion, interaction, etc.)? • Do your data units match the process? • (Messner et al. reading) • Visually and statistically explore your data • Run basic descriptive statistics • Map variables • Look for patterns, outliers • Look for spatial effects (large-scale variation, localized clusters)
How to Measure ‘Space’? • Need to define space in order to measure its effects • Traditional ways (regional dummy variables, distance measures, etc.) • Neighborhood structure • Weights matrix • n x n matrix, where: 0 = not neighbor 1 = neighbor
Weights Matrix • ‘Neighbors’ can be defined as: • Boundaries: • Adjacent units (rook or queen) • Those units sharing some minimum/maximum proportion of common boundary • Centroids • If centroids are within some specified distance • If unit is one of k nearest neighbors defined by centroid distance • Others? • Decision to use one over another somewhat arbitrary • Simpler is generally better • Closer is generally better • Rely on theory, your knowledge, and the ESDA to guide you
Weights Matrix Example Sample Region and Units Simple Contiguity (rook) Matrix
Statistical Tests for Spatial Dependence (Autocorrelation) • Univariate Global Moran’s I • Indicates presence and degree of spatial autocorrelation among variable values across spatial units Where z is a vector of variable values expressed as deviations from the mean Where W is the weights matrix Expected value of I convergences on 0 when n is large; can do significance tests Large positive => strong clustering of similar values Large negative => strong clustering of dissimilar values
Global Moran’s Iand Moran Scatterplot Assesses relationship between the variable value for unit of origin (x axis) against the average of the values its neighbors (y axis)
Local Indicators of Spatial Autocorrelation (LISA) • Local Moran’s I • Decomposes global measure into each unit’s contribution • Identifies the local ‘hotspots’, areas which contribute disproportionately to global Moran’s I
LISA Cluster Maps Homicide Rate 1990 Gini Index 1989
Additional Suggestions for ESDA • Identify outliers and hotspots both statistically and visually • Try taking outlier units out of analysis and see what happens (does Moran’s I change?) • Explore changes in spatial patterns over time • Compare two (or more) regions • Split your sample by a variable of interest • Try different weights matrices • Play around with different covariates – get into your data!
Regression Modeling and SDA • Use theory and ESDA findings to craft your model • Procedure: • Run OLS model • Assess diagnostics • If diagnostics indicate no spatial autocorrelation (or other violations of regression assumptions), OLS model is fine • If diagnostics indicate spatial autocorrelation present, need to consider ways to measure and incorporate spatial structure
OLS Diagnostics • Diagnostics of OLS model will indicate type of spatial effects • If either present, need to identify likely source • Remedies • Spatial heterogeneity (Koenker-Bassett test) • Include covariate which accounts for heterogeneity? • Split region? • Spatial autocorrelation (Lagrange Multiplier tests) • Identify missing variables? • Explore effects of spatially-lagged independent variables? • Use appropriate spatial regression model?
Spatial Regression Models • ESDA and OLS diagnostics tell you that there is spatial autocorrelation • Identify the source (LM tests will help) • Regression residuals (LM-Error) • Mis-match of process and spatial units => systematic errors, correlated across spatial units • Dependent variable (LM-Lag) • Underlying socio-economic process has led to clustered distribution of variable values => influence of neighboring values on unit values • Spatial autocorrelation in both
Spatial Autocorrelation in Residuals => Spatial Error Model y = Xβ + εε = λWε + ξ ε is the vector of error terms, spatially weighted (W); λis the coefficient; and ξ is the vector of uncorrelated, homoskedastic errors • Incorporates spatial effects through error term
Spatial Autocorrelation in Dep. Variable => Spatial Lag Model y = ρWy + Xβ + ε y is the vector of the dependent variable, spatially weighted (W); ρis the coefficient Incorporates spatial effects by including a spatially lagged dependent variable as an additional predictor
Spatial Lag Example Sample Region and Units • Spatial lag = sum of spatially-weighted values of neighboring cells = 1/3(7) + 1/3(5) + 1/3(4) = 5.3
Example: Change in Farm Numbers 1982-1992 • RQ: • How do changes in agricultural structure affect the rates of farm loss during the Farm Crisis? • Hypothesized spatial effect: • spatial dependence through clustering of similar types of farms
Farm Structure Example: Spatial Error – Spatial Lag Regression
Practical Issues with SDA • Scale of observations vs scale of process • Time as a factor in analysis (no natural order) • Definition of proximity • Edge/boundary effects • Modifiable area unit problem • Complexity of topography • Assumptions related to ‘sample’ of attributes
How in the Heck Do I Actually Do This? • Existing statistical software packages (SPSS, SAS) • Have trouble with weights matrix, so need to bring in by hand • Some routines exist, but limited • Comprehensive software packages • S+ Spatialstats • Linear spatial regression; weights construction • Not transparent; no diagnostics; not compatible with ArcView 8.2 • Spatial Toolbox (LeSage) • Matlab routines • Linear spatial regression; weights construction; Bayesian estimation; spatial probit/tobit models
Software Packages (2) • SpaceStat • Linear spatial regression; weights construction; diagnostics; multiple options • Outdated architecture and interface; not supported by Anselin; not compatible with ArcView 8.2 • GeoDa & Spdep (R) • GeoDa strong in ESDA, mapping; weights construction; basic linear spatial regression w/ diagnostics • Spdep has linear spatial regression w/ diagnostics; greater functionality than GeoDa; driven by command language • Both shareware, downloadable • Little support, other than network of those using software • Anselin’s working on PySpace, software to have greater breadth of options, diagnostics, models, and estimation procedures
Additional Resources • Handout has resources listed (web, articles, etc.) • Geographic Information Analysis group within PRI • CSISS, SAL • If interested, consider joining Openspace listserve • AERS faculty
Assignment • Details in handout • Article choices – Use those with * • Due Date • June 19 (Mon.) by 4:30 pm (email preferred) • I will email you comments/grades by June 22 (Thur.) • Re-writes due June 26 (Mon.) by 4:30 pm (email preferred) • Questions?