Download
1 / 24
240 likes | 372 Views
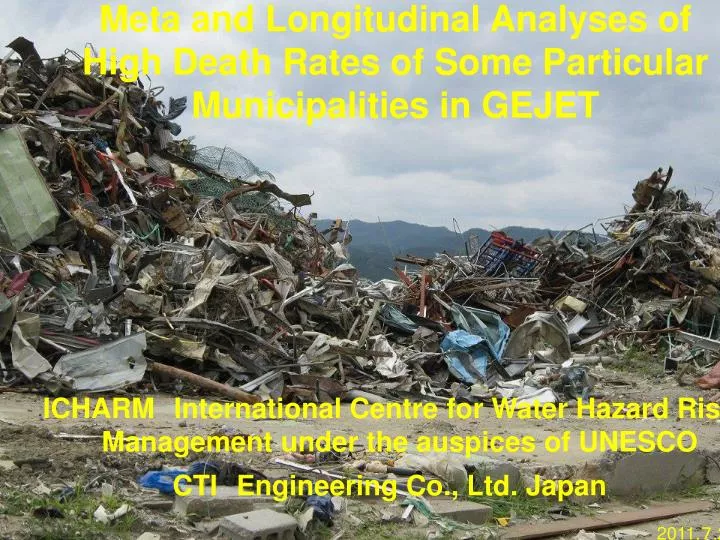
Meta and Longitudinal Analyses of High Death Rates of Some Particular Municipalities in GEJET. ICHARM International Centre for Water Hazard Risk Management under the auspices of UNESCO CTI Engineering Co., Ltd. Japan. 2011. 7 .21. IRDR (Integrated Research on Disaster Risk). Working Groups.

E N D
Meta and Longitudinal Analyses of High Death Rates of Some Particular Municipalities in GEJET ICHARMInternational Centre for Water Hazard Risk Management under the auspices of UNESCO CTIEngineering Co., Ltd. Japan 2011.7.21
IRDR(Integrated Research on Disaster Risk) Working Groups Forensic Investigations Meta-Analysis Longitudinal Analysis Critical Cause Analysis Scenario Analysis Risk Interpretation and Action Disaster Loss Data
Purpose Utilizing Meta and longitudinal Analyses, we try to examine: • Why some municipalities had high human losses and the others less? • Where those differences come from? • Identify the Uniqueness of High Human Losses of Particular Municipalities
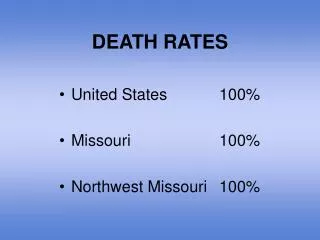
Over view of GEJETin 2011 M 9.0 Death Toll 15,690Missing4,735 Completely Destroyed House112,901 A Partly Destroyed House 144,598 (2011.10.12) Non Tsunami Affected Area 94 (0.5%) Tsunami Affected Area 20,329 (99.5%) Epicentral Area (Wave Source Area) : Extending 200 km east to west by 500 km north to south < From off the coast of Hachinohe to off the coast of Kashima > Tsunami Arrival : Approx. 30min. to 2.5hr (From north <South Sanriku> to south <South Boso Peninsula>) Tsunami Height Tsunami Height : North of Iwate Prefecture to Ozika Peninsula (220km) : Ria Coastline 20-30 m Max.40m South of Ozika Peninsula to Iwaki (150 km) : Straight Coastline 10-20 m Ibaraki Pref. and Chiba Pref. 5-10 m Aomori 5m
Over view of GEJETin 2011 Death Number Human Loss Ratio (IA) <(Death Number / Population) in each Municipalities Inundated Areas> Death Ratio Source : FDMA(9Sep.2011)
Human Loss Ratio : Sanriku Ria Coastal Area Morioka Iwate Sendai Miyagi Fukushima
Methodology (How to investigate) Meta-Analysis :Literature survey and statistical analysis Longitudinal Analysis : Comparative studies of a set of target areas by temporal and historical perspective. Data Source for this Study <Open Source Data> 1. Central Gov. / 2. Regional Gov. / 3. Organizations / 4. Libraries internet source, major newspapers, statistical data, raw data historical documents, historical statistics, local newspapers, vernacular magazines ※ <Closed Source Data> Field survey data mainly can be utilized for critical cause analysis Major Source for this Study (Mainly in Japanese) General info : Cabinet Office, Ministry of Internal Affairs and Communications, Fire Defense Agency Victims related info :National Police Agency Geographical info : Geospatial Information Authority of Japan Local info : Iwate Prefectural Gov., Iwate fukko net, Iwate Statistics Data Base Historical info : Japan Destructive Earthquake General Survey(Usami, 2003) Japan Maps Encyclopedia(Yamaguchi et al., 1980)
Methodology (What do we investigate?) Investigate Human Loss Ratio (IA)in Some Municipalities We need following related info.to investigate ○Past ExperiencesCompared to the Past Tsunami Disasters ○Age Structures in IAAge Structures of the Death People Social Change ○Evacuation ConditionsDistance from Higher Ground Places Evacuation Methods , Warnings , Education/Training, Health However, it is not possible to get those direct data, therefore following approaches were taken Approach ①Past Experiences : try to estimate HVR (will be explained) and compared to the past tsunami (Meiji<1896>,Showa< 1933>) disasters. ②Age Structures : try to find elderly population rates, social participation rates including recent trends by prefectural statistical data. ③Evacuation Conditions: Growing population , infrastructures, and evacuation center’s safety in IAs.
Approaches ①Past Experiences Following indicator was established to compare to the past tsunamidisasters. (Meiji<1896>,Showa< 1933>) Human Vulnerability Ratio = Human Loss (HL) Ratio Completed House Destroyed(CHD) Ratio =HL numbers/ Total Population CHD numbers / Total House numbers = HL numbers Total Population ×CHDnumbers / Total House numbers Therefore, we could estimate HVR = HL numbers Affected Population
Approaches ①Past Experiences HVR (%) Iwate Miyagi Why do they reverse the historical trends? Did they learn from the experience?
Yamada town and Rikuzentakata city Rikuzentakata city Yamada town Approach ② Age Structures Approach ③ Evacuation Conditions
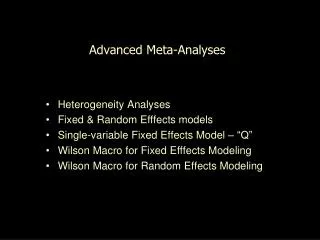
Approaches ② Age Structures Age Structures of Reported Death
Approaches ② Age Structures 21% ▼ 26%▼ Miyako,Ofunatos, and Kuji are included estimations by the impact of annexation. <miyako (2005.6.6) ofunato (2001.11.15)>
Approaches② Age Structures Aging society with less social participation
Yamada town and Rikuzentakata city Rikuzentakata city Yamada cho Approach ② Age Structures Approach ③ Evacuation Conditions
Approaches③Evacuation Conditions Increasing Population in High Risk Area Rikuzentakata city2011.7.11
Approaches ③Evacuation Conditions Takata – area (high risk area)s population Meiji(1896) Showa(1933)
Approaches③ Evacuation Conditions 1913年 1933年 陸前高田 市街地の変化 1952年 2000年 1968年 1960-1966Tsunami Project
Approaches ③Evacuation Conditions Before After
Approaches ③Evacuation Conditions Affected Primary Evacuation Center TOPICS : In the Takata area(high risk area) , Rikuzentakata city , 70-80 evacuated and only 3 survived at Civic Gymnasium. (Source : Kahoku Shinbun)
Conclusion (Try to answer the first 3 inquiries) • Why some municipalities had high human losses and the others less? • Where those differences come from? • Identify the Uniqueness of High Human Losses of Particular Municipalities Methods : Meta and Longitudinal Analysis - Development of the HVR. - Surveys of literatures, statistical data sets, and maps. • Findings: • Yamada town : Aging society with low social participation • especially since 1980s • Rikuzentakata city : Increasing pop. in high risk areas, • especially after the last tsunami • Combination with critical cause analysis should be • implemented to investigate more detail
Suggestion for Decision Making from this study • Counter-measures for Aging Society • should be considered the impact of elderly population. • elderly people is difficult to evacuate. • so many people tried to help elderly people and affected. • 2. Land Use Regulation • should be recognized past tsunami experience. • land use is one of the most effective way for disaster management • Not based on last tsunami but consider every historical tsunami • 3. Education and Training • should be noticed the importance of education and training • School played a key role in GEJET • Difficult to pass down the experience over generations. • Tend to rely on the infrastructure as time passes. • 4. Evacuation Planning • should be remarked the location of evacuation centers and related • planning • These should be considered based on “Worst Case Scenario”
Many Thanks ICHARMInternational Centre for Water Hazard Risk Management under the auspices of UNESCO CTIEngineering Co., Ltd. Japan 2011.7.21