Download
1 / 61
610 likes | 803 Views
Longitudinal Modeling Nathan Gillespie & Dorret Boomsma <br>athan2008Longitudinal neuro_f_chol.mx neuro_f_simplex.mx jepq6.dat. Why conduct longitudinal analyses?. 1. Can improve power by using multiple observations from the same individual - Cross twin cross trait correlation

E N D
Longitudinal ModelingNathan Gillespie & Dorret Boomsma\\nathan\2008\Longitudinalneuro_f_chol.mx neuro_f_simplex.mx jepq6.dat
Why conduct longitudinal analyses? 1. Can improve power by using multiple observations from the same individual - Cross twin cross trait correlation 2. Can examine and estimate time-dependent genetic and environmental effects - Changing magnitude of genetic & environmental influence across time - Same versus different genes across development
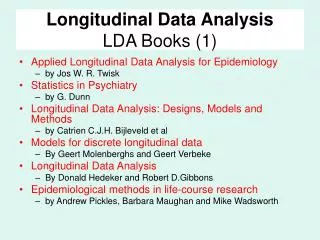
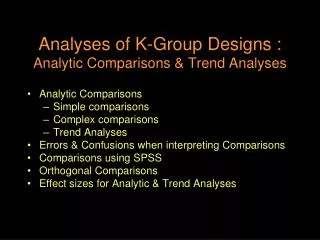
Methods for Longitudinal Data Analysis 1. Cholesky Models 2. Simplex Models Eaves et al., 1986 Boomsma & Molenaar, 1987 3. Growth Curve Models
Aims 1. Revisit the Mx trivariate Cholesky 2. Take a look at simplex or auto-regression models - Explain some of the underlying theory of this form of longitudinal modelling - Run through an Mx script 3. Compare the Cholesky and simplex models
Longitudinal modeling of adolescent personality Introduce longitudinal modeling in the context of personality change Eaves, Eysenck & Martin (1989) - Adult personality - High of genetic continuity over time - Effect stronger in Neuroticism vs Extraversion Genetic continuity in adolescents?
Personality Data Twin Mole and Twin MAPS projects Assess the genetic / environmental etiology of Melanocytic Naevi (common moles) in twins aged 12 & 14 years + Cognition at 16 81 items JEPQ: Psychoticism (P), Extraversion (E), and Neuroticism (N) - Lie (L) X2 = 57.462, df = 45, p = .101, AIC = -32.538, RMSEA = .011
Personality Data Raw continuous data methods Assumptions of mean and variance homogeneity by twin order and zygosity (and necessarily by sex and age) X2 = 57.462, df = 45, p = .101, AIC = -32.538, RMSEA = .011
Cholesky Model Advantages: - Logical: organized such that all factors are constrained to impact later, but not earlier time points - Requires few assumptions, can predict any pattern of change Disadvantages: - Not falsifiable - Does not make predictions about what will happen in the future (as yet unmeasured time points) - Only feasible for limited number of measurements
Cholesky Model Questions you can address: - Magnitude of genetic/environmental influence at each time - Extent to which genetic/environmental influences overlap across time
Run ACE Cholesky Model neuro_f_chol.mx
Cholesky Model Fitting Results Phenotypic correlations Proportions of variance A C E
Simplex or autoregressive models Simplex designs model changes in true scores (y[t]) over time by fitting auto-regressive or Markovian chains Each true score is predicted to be causally related to the immediately preceding latent true score in a linear fashion y[t]n = [t]n y[t-1]n + [t]n [t] = linear regression of latent factor (y[t]) on the previous latent factor (y[t-1]), [t] = new input, change or innovation at time [t], uncorrelated with y[t-1]
Simplex Model Innovations Latent True Scores Observed phenotypes Errors
ACE Simplex Model script neuro_f_simplex.mx
Test for non-significant parameters Run confidence intervals on all parameters ! AE Simplex Structure Get neuro_f.mxs Dr 12 13 ! C transmission coefficients DR 4 5 6 ! C innovations IN X 1 3 3 ENd
Matrix Element Int. Estimate Lower Upper Lfail Ufail X 1 3 3 95.0 0.8752 -1.7949 1.7949 0 2 0 2 ! AE Simplex Structure, Remove final genetic innovation Get neuro_f.mxs Dr 12 13 ! C transmission coefficients DR 4 5 6 ! C innovations DR 3 ENd
Best Fitting Model for Female Neuroticism Degree of genetic continuity Age specific genetic effects Genetic innovation at 14 years Is it related to developmental or hormonal changes during puberty and psychosexual development?
Additional Longitudinal Models Dual Change Score (DCS) Model for Ordinal Data
Additional Longitudinal Models Bivariate Dual Change Score (DCS) Model for Ordinal Data
Methods for Longitudinal Analysis • Cholesky Models • Simplex Models • Growth Curve Models
Simplex Model (Boomsma & Molenaar, 1987)
Genetic Simplex Model x11 x22 x33 x44 n21 n32 n43 A A A A 1 1 1 1 BAC2 BAC3 BAC4 BAC6 u22 u33 u44 u11 1 1 1 1 p21 p32 p43 E E E E z11 z22 z33 z44 x and z = genetic and nonshared environmental innovations respectively n and p = genetic and nonshared environmental transmission respectively u = error variances
Simplex Model • Advantages: • Makes restrictive predictions about covariance pattern • Falsifiable
Today’s example • Grant et al., 1999, Behavior Genetics, 29, 463-472. • Australian alcohol challenge data, collected between 1979 and 1981 • Mean age = 23.5 years • Subjects drank 0.75 g/kg alcohol at a steady rate over a 20-minute period. Blood Alcohol Concentration (BAC) was assessed at 6 points after consumption:
A simplex correlation pattern… • Sample correlations (the DZM twin A quadrant of an intraclass correlation matrix)
Practical - Simplex Model x11 x22 x33 x44 n21 n32 n43 A A A A 1 1 1 1 BAC2 BAC3 BAC4 BAC6 u22 u33 u44 u11 1 1 1 1 p21 p32 p43 E E E E z11 z22 z33 z44 x and z = genetic and nonshared environmental innovations respectively n and p = genetic and nonshared environmental transmission respectively u = error variances
Practical - Simplex Model x11 x22 x33 x44 n21 n32 n43 A A A A 1 0 0 0 0 2 0 0 0 0 3 0 0 0 0 4 1 1 1 1 BAC2 BAC3 BAC4 BAC6 u22 u33 u44 u11 1 1 1 1 p21 p32 p43 E E E E z11 z22 z33 z44 x and z = genetic and nonshared environmental innovations respectively n and p = genetic and nonshared environmental transmission respectively u = error variances
Practical - Simplex Model ? ? ? ? A A A A 1 1 1 1 BAC2 BAC3 BAC4 BAC6 ? ? ? ? 1 1 1 1 E E E E ? ? ? ? x and z = genetic and nonshared environmental innovations respectively n and p = genetic and nonshared environmental transmission respectively u = error variances
Full Genetic Simplex Model 12.0279 6.5234 .7036 4.2649 0.9892 0.5332 1.3123 A A A A 1 1 1 1 BAC2 BAC3 BAC4 BAC6 -0.1840 -0.1840 -0.1840 -0.1840 1 1 1 1 0.7001 0.5027 0.4130 E E E E 9.4624 5.0094 10.3650 5.1284 Basic_simplex.mxo -2*LL=4620.028, 23 est. parameters, 606 df
Sub-Models • Is the error variance on individual variable assessments significant? • Is the genetic innovations on BAC6 significant? BAC4? BAC2?
Sub-Models • Is the error variance on individual variable assessments significant? - drop 200 • Is the genetic innovations on BAC6 significant? BAC4? BAC2? - drop 4, 3, 2
Simplex Model • Advantages: • Makes restrictive predictions about covariance pattern • Falsifiable • Disadvantages: • Makes restrictive predictions about covariance pattern (future depends on current state only) • Number of parameters increases with number of measurements
Methods for Longitudinal Analysis • Cholesky Models • Simplex Models • Growth Curve Models
Latent Growth Curve Model (shown here as linear) • Mean Level of the Trait (Intercept) • Rate of Change In Trait (Slope)
Latent Growth Curve Model (shown here as linear)
Genetically Informative Latent Growth Curve Model
Genetically Informative Latent Growth Curve Model →Like a bivariatemodel!