Download
1 / 10
130 likes | 393 Views
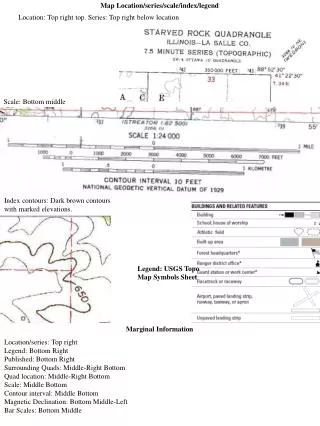
Map Scale . The Elements of a Map: All maps should have 5 essential elements: 1. Title 2. Grid – covered last week 3. Data and Legend 4. Direction indicator 5. Scale Title: should include WHAT, WHERE & WHEN. Example: Energy Consumption In France, 1978-1982.

E N D
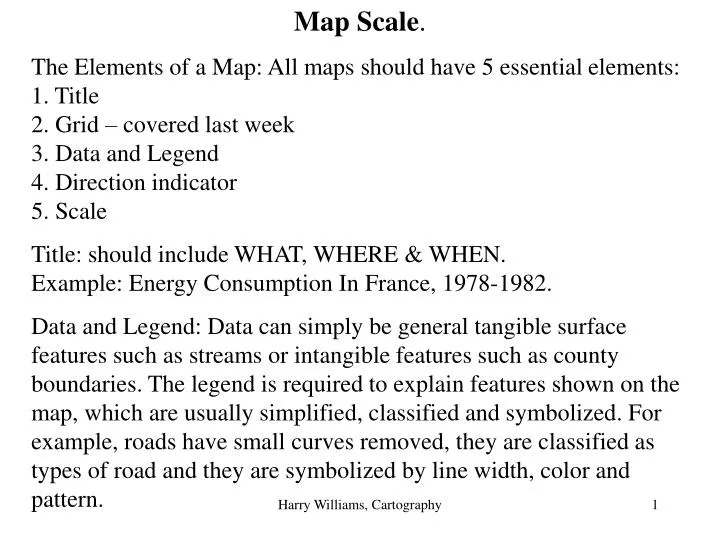
Map Scale. The Elements of a Map: All maps should have 5 essential elements:1. Title2. Grid – covered last week3. Data and Legend4. Direction indicator5. Scale Title: should include WHAT, WHERE & WHEN.Example: Energy Consumption In France, 1978-1982. Data and Legend: Data can simply be general tangible surface features such as streams or intangible features such as county boundaries. The legend is required to explain features shown on the map, which are usually simplified, classified and symbolized. For example, roads have small curves removed, they are classified as types of road and they are symbolized by line width, color and pattern. Harry Williams, Cartography
Example USGS map symbols for roads: Harry Williams, Cartography
Direction Indicator: The familiar north arrow may be added to maps of small areas to provide a directional reference for the reader. N On maps with a grid system, the grid lines provide a directional reference – although it should be remembered that meridians are not parallel on many projections (such as the conic). On maps of familiar areas (for example, the U.S., a direction indicator may not be necessary - it’s assumed everyone knows the orientation of the U.S. Harry Williams, Cartography
On USGS topographic maps, a declination diagram containing three norths is shown in the bottom margin of the map sheet: The three norths are:1. True north – points to the north pole; aligned to central meridian on the map sheet.2. Grid north – shows the difference between true north and the UTM grid north.3. Magnetic north – points to the magnetic north pole; same as compass north.(note: the angles are NOT drawn accurately, but the numbers are correct). Harry Williams, Cartography
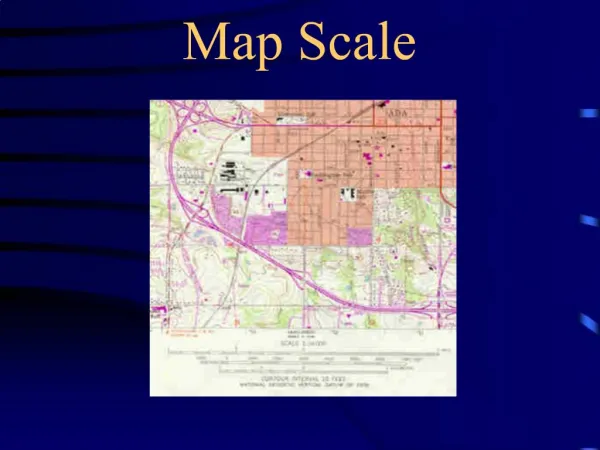
Scale: • Map scale is the ratio of the map distance to the true distance. • Three types of scale: • A statement in words: “six inches to one mile”, “ten centimeters represents one kilometer”. By convention, one of the measurements is always “one”. This method gives an immediate impression of distance on the map without having to use math. Limited accuracy. 2. Linear, graphic or bar scale: Harry Williams, Cartography
Found in bottom margin of map. Allows direct measurement with ruler or dividers (without math). Automatically adjusts to photographic enlargement or reduction. Limited accuracy. 3. Representative Fraction (RF): e.g. 1:24,000 or 1/24000. This means 1 unit of distance on the map represents 24,000 units of distance in the “real world”. The left-hand side is always “1”. Can be any units – cm, inches, feet etc. Example: At an RF of 1:50,000, how many miles are represented by a map distance of 3 inches? 3 inches on map represents 3x50,000 inches = 150,000 inches=150,000/63360 miles = 2.37 miles. Advantages: greater accuracy; works with any unit of measurement. Example 2 (for class): At an RF of 1:24,000, how many km are represented by 10 cm? Harry Williams, Cartography
Area Measurement on Maps:1. Based on geometry: OK for regular shapes e.g. squares, rectangles, circles, triangles. Very important to understand that linear and areal conversions are NOT the same e.g. 1000 m in 1 km;1,000,000 m2 in 1 km2. Example: RF = 1:24,000. Find the area in km2 3 cm 6 cm 3 cm represents 3x24,000 cm = 72,000 cm = 0.72 km.6 cm represents 6x24,000 cm = 144,000 cm = 1.44 km.0.72 km x 1.44 km = 1.04 km2.Always covert to required units first, then multiply. Harry Williams, Cartography
2. Grid Square Method: the irregular shape is traced onto a regular grid (e.g. 1 cm squares). The number of whole and “half” squares within the shape are counted e.g. 64 whole squares; 62 “half” squares. The 62 “half” squares equal 31 whole squares, so there are 95 whole squares total. At an RF of 1:24,000, each square represents 24,000 cm x 24,000 cm = 0.24 km x 0.24 km = 0.0576 km2. Therefore, total area = 95 x 0.0576 =5.472 km2. Whole square“half” square Harry Williams, Cartography
Polar Planimeter: this device is used to trace the perimeter of an irregular shape. Readings from the dials are then used to calculate the area. It will be demonstrated in the lab. Harry Williams, Cartography