Download

1 / 42
420 likes | 515 Views
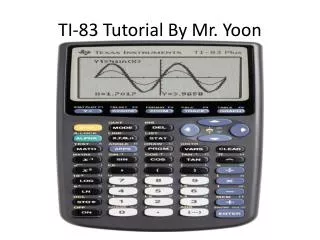
TI-83, TI-83 + Technology Integration. DAY 1 Data Management. Basic TI-83 Keys. On – Play Time! (5 min) Multifunction keys Screen brightness y ^ Negative vs. subtract (-) - Arithmetic operations Clear vs. Quit. The Home Screen and BEDMAS. It’s a calculator!

E N D
TI-83, TI-83+Technology Integration DAY 1 Data Management HRSB, 2009
Basic TI-83 Keys • On – Play Time! (5 min) • Multifunction keys • Screen brightness y^ • Negative vs. subtract (-) - • Arithmetic operations • Clear vs. Quit HRSB, 2009
The Home Screen and BEDMAS • It’s a calculator! • 6 + 3 * 4 = 18 • It remembers stuff! ENTRY (2nd ENTER) ANS (2nd (-)) STO2nd, entry, STO, X, ENTER – x2+2x+1, ENTER • It changes stuff! (123456) DEL – highlight and DEL INS (2nd DEL) CLEAR – line, homesreen HRSB, 2009
The Home Screen and BEDMAS • BEDMAS rules! Brackets Exponents Division(in order they occur) Multiplication Addition Subtraction Brackets are extremely important! HRSB, 2009
Key Considerations q r o p s • Memory – Resetting; Clearing Lists/entries • ‘The Big Five’ – • Mode: Normal SCI (power 10) ENG Digits both left and right of decimal 1 Digit left of decimal up to 3 digits • Catalog, Math • TI-83/83+ KEY List (handout) HRSB, 2009
DATA MANAGEMENT HRSB, 2009
The Central Measures of Tendency(p.14 Booklet) Describing the Data Average: a number that is typical of a set of numbers. There are three ways of measuring the average: • Mean ( ) • Median • Mode HRSB, 2009
The Mean ( ) • Also commonly known as the ‘average’ • Calculated by dividing the sum of the data set by the number of data values in the set. EX: What is the class average (to the nearest whole number), given the following test scores? 16 18 20 20 22 24 24 28 28 = = = 22 HRSB, 2009
The Median • The middle value in a data set, when arranged in order from least to greatest. • Odd number of data scores 3 8 12 15 15 15 17 18 23 Least↑Greatest middle • Even number of data scores 3 8 12 14 15 17 18 20 21 23 Least↑↑Greatest middles
The Mode • The measurement that occurs the most often in a set of data scores. • You can have more than one mode for a data set. • It is possible to have NO mode for a set of data scores. HRSB, 2009
The Range • The difference between the largest data value and the smallest data value within a particular data set. • EX: 2 4 4 8 8 15 21 Range: 21 – 2 = 19 Activity Time – Yellow Page 1 HRSB, 2009
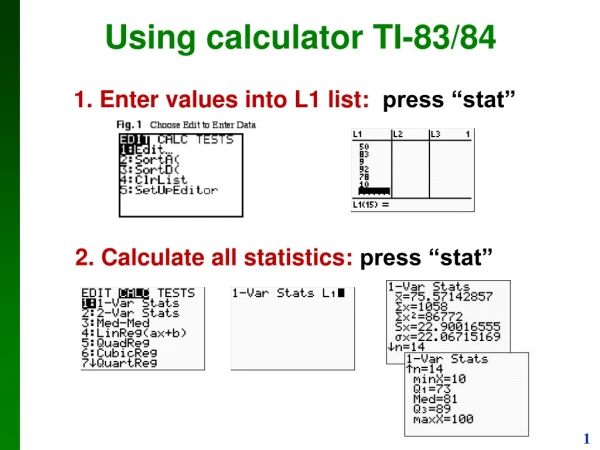
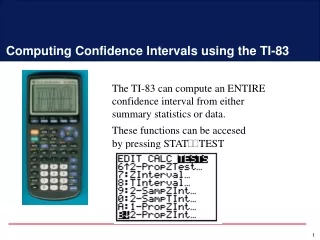
Measures of Central Tendency:Using the Calculator 1] For each set of data determine the mean, median, mode and range. Express your answers to two decimal places. (see Yellow Page 2 for calc. instructions) • 20, 24, 28, 18, 26, 24, 12, 16, 20 • 5, 9, 13, 12, 2, 4, 0, 1, 7, 15, 11 2] Calculate the mean, median, mode and range for the following data set: 12.5, 12.4, 12.2, 12.7, 12.9, 12.2, 12.3, 12.2, 12.6, 12.8 HRSB, 2009
Answers: [1] (a) mean: 20.89, median: 20.00, mode: 20 & 24 (b) mean: 7.18, median: 7.00, mode: no mode [2] mean: 12.48, median: 12.45, mode: 12.2 Now try: “The Central Measures of Tendency (A)” – yellow worksheet HRSB, 2009
The Central Measures of Tendency (A) (b) Alysia (c) Graduation Average: Alysia – 86.33%; Laurie – 85.17%; Ahmed – 78.83% (d) Both Alysia and Laurie (e) Laurie; Both other students…Fate is sealed! HRSB, 2009
The Central Measures of Tendency (B) • Mean: 9.33 Median: size 10 Mode: 10 (b) Discussion (c) Discussion HRSB, 2009
Extension: pg.212 Grade 8 TextMathematics 8 – Focus & Understanding • Yellow Page 5 – Table Groups (Check on Overhead) • Last week Mr. Brighton measured the heights of his seven prized oak seedlings. He noted that the range of the heights was 6.20 cm and that his tallest seedling measured 10.80 cm. The mean height was 7.40 cm, the median height was 7.60 cm, and the mode was 8.00 cm. What could be the heights of all seven seedlings? HRSB, 2009
Extension Answer (s)(Many solutions) IE: 4.6 5.8 7 7.6 8 8 10.8 ____ ____ ____ ____ ____ ____ ____ Must Have: 4.6 ____ ____ 7.6 ____ ____ 10.8 HRSB, 2009
Box and Whisker Plots(pg.15-16 Booklet) • Orange Sheet 1 • A type of graph used to display data; shows how the data is dispersed around the median but does not show specific scores in the data. • Key terms: - Lower and Upper Extremes – Max & Min Value - Lower Quartile – The median of the lower half of the data - Upper Quartile – The median of the upper half of the data HRSB, 2009
How to Construct a Box and Whisker Plot • 1] Construct a # line and mark the upper and lower extremes. The difference between extremes represents the range. • 2] Find the median of the data. Mark this value on # line. • 3] Find the lower quartile. Mark this value on the # line. • 4] Find the upper quartile. Mark this value on the # line. • 5] Construct a box to show where the middle 50% of the data are located. (Now try Orange Sheet 2)
English Assignment Results… Now let’s display the same data using the TI-83+… 50, 50, 50, 50, 50, 50, 50 60, 60, 60, 60, 60, 60, 60 70, 70, 70,. 70, 70, 70, 70
Activity: “Who do we want on our Team?” • Orange Page 3 • Complete in Table groups and discuss your results • Debrief (next slide) HRSB, 2009
“Who do we want on our Team?” Anne Susan Sonya Discussion: - Middle 50% of the data (the spread) - Consistency - Outliers HRSB, 2009
Box and Whisker Plots – Exercise (A) • In table groups complete the “Raisin Activity” using the TI-83+ • Discuss your results with table members • Debrief – next slide HRSB, 2009
Box & Whisker plots:Using the Calculator • Exercise A: Brand A Brand B b) Discussion c) Discussion HRSB, 2009
Box & Whisker plots:Using the Calculator • Exercise B: [1] Light Bulbs Brand A Brand B Exercise B: [2] Television • Median- 8 • Range – Between 6 – 11 hours • Discussion HRSB, 2009
Histograms (pg. 17-18 booklet) • Another way to display data; used when there are many pieces of continuous data • Comprised of a graph in which the horizontal axis is a #line with values grouped in Bins (classes), and vertical axis shows the frequency of the data within each bin. • Bin: a grouping of the data values (i.e. 0 – 5) • Frequency Table: shows how often each data value, or group of values, occurs. HRSB, 2009
Frequency Table (i.e.) • How to Make a Histogram • Choose a bin size based on your range of data values. (keep # of bins to ≤10) – Discuss • 2. Create a Frequency Table showing group frequencies. • 3. Graph the frequency table; connect the bins together in a ‘Bar-graph’ fashion. (let’s try exercise A, Blue Sheet 1)
Histograms ex. A 2 6 17 12 24 22 9 10 3 24 5 13 8 14 21 20 11 8 19 7 Bin Sizes: 0 – 5, 5 – 10, 10 – 15, 15 – 20, 20 – 25 Frequency Table:
Histogram (A) Frequency 0 5 10 15 20 25 Bins HRSB, 2009
Histograms (B) Possibilities: What do we see in each case? #1 - #2 - Let’s use the technology to create a histogram for “Nancy’s Basketball scores” on Blue Sheet 3…(sketch)
Calculator Applications (pg 17-18 Booklet): NancyJohnSam 1] Describe each of the Histograms. 2] Describe each person as a basketball player. 3] Compare these players with Janie’s Data distribution: Janie
Histogram Extension Problem • Blue Sheet 4 • In table groups, complete the ‘Black Spruce Tree’ activity • Discuss results • Refer to solution on next slide HRSB, 2009
Extension Problem (Discussion) Forest Environment VS. Nursery Environment Forest: Nursery:
Scatter plots – Line of Best FitRegression! • A graph of ordered pairs of numeric data • Used to see relationships between two variables or quantities • Helps determine the correlation between the Independent & dependent variables • Correlation: a measure of how closely the points on a scatter plot fit a line • The relationship can be strong, weak, positive or negative • + Correlation – As indep.Var ↑, Dep. Var ↑ • - Correlation – As indep. Var ↑, Dep. Var ↓
Line of Best Fit • Drawn through as many data points as possible • Aim to have an equal amount of data points above and below the line • Does NOT have to go through the origin • Allows us to generate an equation that describes the relationship using an equation form (ie: y = mx+b) Example 1, Pink Sheet 1 – Discuss (draw LOBF for each) Example 2, Pink Sheet 1, Let’s do together using the TI-83+ HRSB, 2009
Calculator Applications: 10.(pg. 38-42 Booklet) • Example 2: Line of Best Fit 1. 2. 3. 4. 5. 6. 7. 8. 9.
Linear Regression & Correlation Coefficient (r) • Determining the Equation for the Line of best fit can be referred to as: Regression Analysis • We create a model that can be used to predict values of the Dep. Var. based on values of the Indep. Var. • The ‘r’ value – Correlation Coefficient - measures the strength of the association of the 2 variables; (-1 → +1) – the closer to either, the stronger the relationship Pink Sheet 3 – complete in table groups – (steps on page 4, 5 pink sheets) HRSB, 2009
Regression AnalysisPg.383, Gr. 9 Text, #13 Window Scatter plot Correlation • Equation Graph HRSB, 2009
Extrapolating data: • Determining # injured in 2010: Change ‘window’ to include this x parameter (Xmax – 2050) The new graph: Next Key Strokes: 2nd CALC 1:value Type in 2010 Y value when x = 2010, is HRSB, 2009
Regression Analysis Cont. • Example 3, 4: Pink Sheet 3 - EXTENSION • Looking at Parabolic & Exponential Relationships • Complete these problems together HRSB, 2009
THE END • Q & A • Possibilities for further extension on TI-83+ • Suggestions for future PD sessions • Wrap-up; Sub Claim Forms Contact Information: Sohael Abidi Leader, Mathematics Halifax Regional School Board Ph: 464-2000 ext. 4456 sabidi@hrsb.ns.ca HRSB, 2009