Download
1 / 33
350 likes | 470 Views
TI – 83 Plus. A Quick Reference Presentation for AMSTI Year 1 Training. Previewing Keyboard. To turn on, press ON . To turn off, press 2 nd ON .

E N D
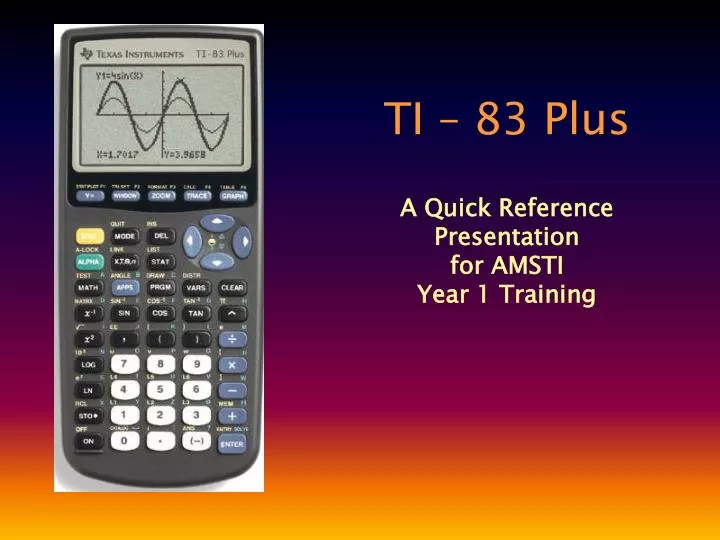
TI – 83 Plus A Quick Reference Presentation for AMSTI Year 1 Training
Previewing Keyboard • To turn on, press ON. • To turn off, press 2ndON. • To darken screen, toggle 2nd and p (up cursor). Notice the changing number in the upper right corner. The higher the number the darker the screen.
Previewing Keyboard • To lighten screen, toggle 2nd and q (down cursor). Notice the changing number in the upper right corner. The lower the number the lighter the screen. • If the screen display must be set at 8 or higher to be visible, it is time to change the batteries.
Previewing Keyboard • There are many menus and embedded menus in the graphing calculator. Should you find yourself “lost”, you can return to the home screen by using 2nd QUIT. ( “Quit and go home”).
Previewing Keyboard • The home screen is available for normal calculator computations. • Home screen cursor is a black square. • 2nd function cursor shows a white arrow in the square. h
Previewing Keyboard • ALPHA enters alphabetic characters (offer students a few minutes to enter a message before continuing). • Do not use ALPHA to enter variables. • X, T, q, n enters one of the four symbols as variables.
Previewing Keyboard • Edit an entry using the backspace cursor, DEL, or 2nd INS keys
Clean-Up Procedure Clean up time – Returns display to the best settings for future work! Follow the triangular pattern formed by the keys: Y=, ZOOM, and MODE.
Clean-Up Procedure • Check MODE All menu items should be highlighted on the left.
Clean-Up Procedure • Clear y = This step is optional, but works well with students to get them all on the same page.
Clean-Up Procedure • Zoom 6 This step sets your window at a standard setting. It may be adjusted later either manually or with the Zoom feature.
Optional Clean-Up Procedure • Check Stat Plots off To check stat plots you must use the 2nd key. This step is a great troubleshooter.
Optional Clean-Up Procedure • Format To check FORMAT you must use the 2nd key. Highlight items on the left. This step is a good Troubleshooter, also.
Zoom Zoom is used to quickly adjust the display window. • Frequently used zoom keys: • 2: Zoom In. • 3: Zoom Out. • 5: Zoom Square. • 6: ZStandard
Window Window is used to manually set the window for the best display of the graph instead of using the Zoom feature.
Window • Xmin and Xmax give the bounds on the x-axis • Ymin and Ymax give the bounds on the y-axis • Xscl and Yscl control the intervals between tick marks on the axes • Xres controls how finely it is drawn and generally should be left alone.
Trace Trace is used to move a point along a graph, showing its x and y values. • Use the up and down arrows to jump from one graph to another. • Use the right and left arrows to move the point along a graph.
Practice Editing, Using Y = ,and Graphing • Press Y = • Complete the equation with: – 3x4 + 10x – 4 • Edit the equation to: – 3x2 + 7x + 4 • Press GRAPH • To view a table of x, y values for the graph, press TABLE.
Practice Editing, Using Y = ,and Graphing • Suppose you want to prove that 3(x + 5) is not equal to 3x + 5, but is equal to 3x + 15. • Type all three equations onto the Y = screen. • Highlight the “=“ on Y3 = 3x + 15, press ENTER to toggle off the “=“, so that this equation will not be graphed.
Practice Editing, Using Y = ,and Graphing • Press GRAPH. Two distinct lines are graphed, so the equations are not the same. • Turn off Y2 = 3x + 5, and turn on Y1 and Y3. GRAPH. Only one line appears, so the two equations are the same. • Verify values by using TABLE.
Stat STAT is used to enter data into lists and manipulate them.
Stat • To enter data into a chosen list, press STAT, highlight Edit and ENTER, or just press 1. • Enter data in list 1 (L1) or use arrows to move to other lists. • Formulas may be entered in lists.
Using STAT to Average Grades • Press STAT and then enter Edit. • Under L1 list 4 student ID numbers (cannot use names). • Under L2 list each student’s score on the first test: 84, 97, 86, 75.
Using STAT to Average Grades • Under L3 list 2nd test scores: 87, 89, 95, 84. • Above L4 type the averaging formula and enter: (L2 + L3)/2.
How could each average be shown as rounded to the nearest whole number? • Go to FORMAT and select Float 0 decimal places.
Stat Plot STAT PLOT is used to graph data from selcted lists. • Turn Plot on. • Select type of graph. • Select list(s) of data. • Choose type of plotting mark.
Using STAT PLOT to Make Scatter Plots To clear old data: • Press STAT • Place cursor on List heading • Press CLEAR and ENTER
Using STAT PLOT to Make Scatter Plots Enter new data in appropriate lists. • L1Hours Spent Studying: 2, 1, ½, 4, 0, 3 • L2Score on Test: 87, 82, 90, 97, 64, 89
Using STAT PLOT to Make Scatter Plots • Display menu by pressing 2nd and STAT PLOT • Turn on Plot 1 (highlight Plot 1, Enter, highlight ON on new screen).
Using STAT PLOT to Make Scatter Plots • Choose type of graph (must be a reasonable choice for type of data listed). • Choose type of mark • Press ZOOM 9 (ZoomStat) • Graph
Families of FunctionsUse the equation y = ax + k Problem 1: Varying a • Group selects one value for k for all equations in Problem 1. • Each person in group selects a different value for a. • Each person graphs lines on calculator and then on grid worksheet.
Families of FunctionsUse the equation y = ax + k Problem 2: Varying k • Group selects one value for a for all equations in Problem 2. • Each person in group selects a different value for k. • Each person graphs lines on calculator and then on grid worksheet.
Families of FunctionsUse the equation y = ax + k • Each group will make two planes on graph poster paper. • The group’s lines from Problem #1 will be graphed on the first plane. • The group’s lines from Problem #2 will be graphed on the second plane. • Write the group’s observation about each problem and hang the poster on the wall.