Download
1 / 12
150 likes | 215 Views
Using calculator TI-83/84. 1. Enter values into L1 list: press “stat”. 2. Calculate all statistics: press “stat”. n !. P(x) = • p x • q n-x. ( n – x )! x !. The probability of x successes among n trials for any one particular order. Number of

E N D
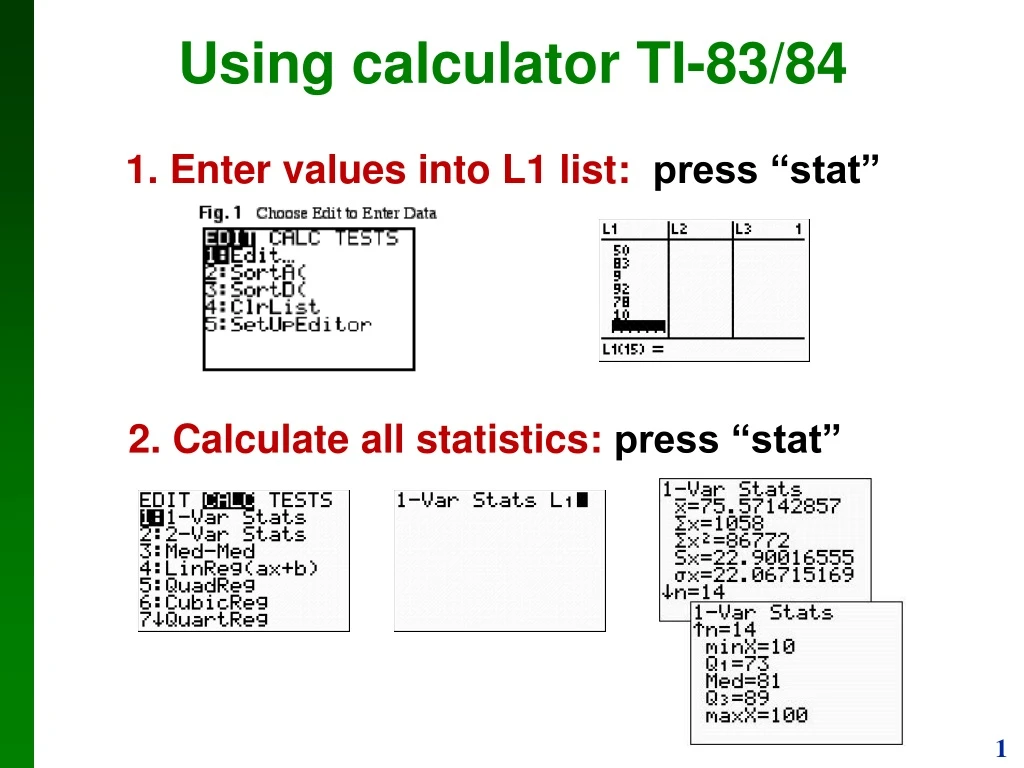
Using calculator TI-83/84 1. Enter values into L1 list: press “stat” 2. Calculate all statistics: press “stat”
n! P(x) = •px•qn-x (n –x )!x! The probability of x successes among n trials for any one particular order Number of outcomes with exactly x successes among n trials Binomial Probability Formula
Using TI-83/84 • Press 2nd VARS to get the DISTR menu • Scroll down to binomialpdf( and press ENTER • Type in three values: n, p, x (separated by commas) and close the parenthesis • You see a line like binomialpdf(10,.3,6) • Press ENTER and read the probability of the value x (successes)in n trials
Alternative use of TI-83/84 • Press 2nd VARS to get the DISTR menu • Scroll down to binomialcdf( and press ENTER • Type in three values: n, p, x (separated by commas) and close the parenthesis • You see a line like binomialcdf(10,.3,6) • Press ENTER and read the combined probability of all values from 0 to x (i.e., probability that there are at most x successes)
µ = [x•P(x)]Mean 2 = [(x –µ)2 • P(x)] Variance 2= [x2 • P(x)] – µ2Variance (shortcut) = [x 2 • P(x)] –µ2Standard Deviation Mean, Variance and Standard Deviation of a Probability Distribution
Using TI-83/84 calculator • Press the STAT button and choose EDIT • Enter the x-values into the list L1 and the P(x) values into the list L2 • Press the STAT button and choose CALC • Choose 1-Var Stats and press ENTER • Type in L1 then , (comma) then L2 on that line, you will see 1-Var Stats L1,L2 • Press ENTER • You will see x-bar=…, it is actually m (mean) and sx=…, it is actually s(st. deviation)
Normal Distribution by TI-83/84 • Press 2nd VARS to get the DISTR menu • Scroll down to normalcdf( and press ENTER • Type in two values: Lower, Upper (separated by commas) and close the parenthesis • You see a line like normalcdf(-2.00,1.50) • Press ENTER and read the probability.
Normal Distribution by TI-83/84 (continued) If you do not have an upper value, type 999. Example: for P(z>1.2) enter normalcdf(1.2,999) If you do not have a lower value, type -999. Example: for P(z<0.6) enter normalcdf(-999,0.6)
Inverse Normal by TI-83/84 • Press 2nd VARS to get the DISTR menu • Scroll down to invNorm( and press ENTER • Type in the desired area and close the parenthesis • You see a line like invNorm(0.95) • Press ENTER and read the z-score. • Round off to three decimal places.
Normal Distribution by TI-83/84 • Press 2nd VARS to get the DISTR menu • Scroll down to normalcdf( and press ENTER • Type in four values: Lower, Upper, Mean, St.Deviation(separated by commas) and close the parenthesis • You see a line like normalcdf(-999,174,172,29) • Press ENTER and read the probability.
Inverse Normal by TI-83/84 • Press 2nd VARS to get the DISTR menu • Scroll down to invNnorm( and press ENTER • Type in the desired area, mean, st.deviation and close the parenthesis • You see a line like invNorm(0.995,172,29) • Press ENTER and read the x-score.