Download
1 / 11
120 likes | 275 Views
3.3 Expanded Graphing Functions using a TI-83/TI-84. Indicators: PFA9, PFA1, PFA7, PFA15. Created by Anny Lin, Crestwood Middle School Edited by Eddie Judd, Crestwood Middle School. A graphing calculator can graph different types of equations accurately and quickly.

E N D
3.3 Expanded Graphing Functions using a TI-83/TI-84 Indicators: PFA9, PFA1, PFA7, PFA15 Created by Anny Lin, Crestwood Middle School Edited by Eddie Judd, Crestwood Middle School
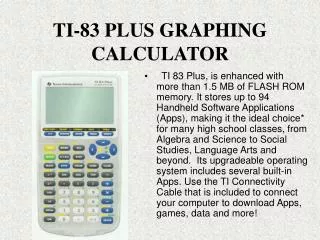
A graphing calculator can graph different types of equations accurately and quickly. Linear equations are usually graphed in the standard viewing window. The standard viewing window is [-10, 10] by [-10, 10] with a scale of 1 on each axis. To quickly choose the standard viewing window on a TI-83/84 Plus, press 6.
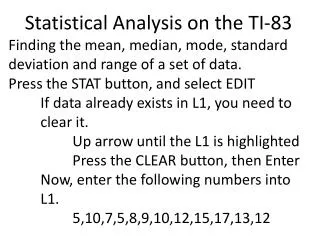
Graph 2x - y = 3 on a TI-83/84 Plus graphing calculator. Step 1 Enter the equation in the Y= list. The Y= list shows the equation or equations that you will graph. Equations must be entered with the Y isolated on one side of the equation. Solve the equation for y, then enter it into the calculator.
Sometimes a complete graph is not displayed using the standard viewing window. A complete graph includes all of the important characteristics of the graph on the screen. These include the origin and the x- and y-intercepts. Notice that the graph of 2x - y = 3 is a complete graph because all of these points are visible.
When a complete graph is not displayed using the standard viewing window, you will need to change the viewing window to accommodate these important features. You can use what you have learned about intercepts to help you choose an appropriate viewing window.
Graph y = 3x - 15 on a graphing calculator. Step 1 Enter the equation in the Y= list and graph in the standard viewing window. Clear the previous equation from the Y= list. Then enter the new equation and graph.
Step 2 Modify the viewing window and graph again. The origin and the x-intercept are displayed in the standard viewing window. But notice that the y-intercept is outside of the viewing window. Find the y-intercept. Since the y-intercept is -15, choose a viewing window that includes a number less than -15. The window [-10, 10] by [-20, 5] with a scale of 1 on each axis is a good choice.
EXERCISES Graph each linear equation in the standard viewing window. Determine whether the graph is complete. If the graph is not complete, choose a viewing window that will show a complete graph and graph the equation again. 1. y = x + 2 2. y = 4x + 5 3. y = 6 - 5x 4. 2x + y = 6 5. x + y = -2 6. x - 4y = 8 7. y = 5x + 9 8. y = 10x - 6 9. y = 3x - 18 10. 3x - y = 12 11. 4x + 2y = 21 12. 3x + 5y = -45 For Exercises 13–15, consider the linear equation y = 2x + b. 13. Choose several different positive and negative values for b. Graph each equation in the standard viewing window. 14. For which values of b is the complete graph in the standard viewing window? 15. How is the value of b related to the y-intercept of the graph of y = 2x + b?