Download
1 / 14
140 likes | 284 Views
Reionisation and the cross-correlation between the CMB and the 21-cm line fluctuations. Based on arXiv:0802.3893. Hiroyuki Tashiro. IAS, ORSAY. In the collaboration with. N. Aghanim (IAS, Orsay) M. Langer (IAS, Orsay) M. Douspis (IAS, Orsay)

E N D
Reionisation and the cross-correlation between the CMB and the 21-cm line fluctuations Based on arXiv:0802.3893 Hiroyuki Tashiro IAS, ORSAY In the collaboration with N. Aghanim (IAS, Orsay) M. Langer (IAS, Orsay) M. Douspis (IAS, Orsay) S. Zaroubi (Uuiv. of Groningen) 43rd Rencontres de Moriond La Thuile, Italy
Introduction When does reionisation start? How does reionisation proceed? Reionisation : We know only two observational constraints Gunn-Peterson effect : absorption of the from the high redshift quasars Neutral hydrogen fraction (Fan et al, 2006) CMB anisotropies : Thomson scattering of CMB photons by electrons during reionisation Optical depth (WMAP 5 year data) To obtain new constraints Redshifted 21 cm line fluctuations one of most promising probing methods for reionisation
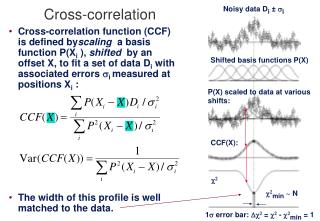
The cross-correlation with CMB temperatures Alvarez et al. (2006) CMB Doppler effect Kinematic Sunyaev-Zeldvich effect Salvaterra et al. (2005) Absorb 21 cm line from CMB { 21 cm transitions of HI Emit 21 cm line to CMB Produce fluctuations of CMB brightness temperature Line emission : redshifted by the cosmological expansion Multi frequency observations allow us to obtain redshift slices of Universe Observation projects : LOFAR, MWA, SKA In this talk, The 21 cm cross correlations with CMB polarisation from the reionisation epoch
21 cm lines fluctuations In order to obtain the cross correlations, we need expression for spherical harmonics coefficients, Linear expression of the fluctuations (during the reionisation epoch) The 21 cm line fluctuations depends on and Expanded on the spherical harmonics
E-mode polarisation Thomson scattering + quadrupole in CMB temperature anisotropies produce the CMB polarisation E-mode polarisation Primordial density fluctuations Expression for the spherical harmonics Source term : Quadrupole E-mode polarisation depends on initial gravitational potential
The angular power spectrum of the cross-correlation From of E-mode polarisation and 21 cm lines, we can obtain the cross-correlation : specified by the cosmological model ( ) : specified by the reionisation model
Toy model of reionisation Evolution of average ionised fraction : reionisation epoch : reionisation duration To obtain , we make two assumptions • ionising photons comes from collapsed objects ( T_vir > 10^4 ) > • Ionised fraction is related to the ratio of ionising photons per hydrogen Cross power spectrum Alvarez et al. (2006) : Transfer function of matter : average bias
Angular power spectrum of the cross-correlation • Spectrum shape reflects • the quadrupole of CMB 1-st peak position The angular separation scale of the quadrupole component • The duration of reionisation induces damping of the oscillations on small scales If reionisation has the long duration, quadrupole components during reionisation are superposed. The longer it lasts, the more oscillations are damped.
Angular power spectrum of the cross-correlation is the redshift, when The dependence on the reionisation epoch The shapes of power spectrum does not strongly depend on the reionisation epoch Multi frequency observations The evolution of first peak If the amplitude reaches to maximum , E-mode polarisation : electron density 21 cm fluctuation : HI density
Angular power spectrum of the cross-correlation Double reionisation model The number of peaks in the first peak evolution is the number of crossings of the 0.5 level of the ionised fraction
Summary The cross-correlation between 21 cm lines and E-mode polarisation 21 cm lines : neutral hydrogen E-mode polarisation : the optical depth • Shape of the power spectrum : • the quadrupole component of CMB temperature anisotropies The first peak position gives the scale of the quadrupole • Damping on small scales : • signature of the duration of reionisation The detection or no detection of the signal gives constraints on the duration • first peak evolution : • the signal reaches its maximum when x_e=0.5 We can follow the redshift evolution of ionisation fraction For details, see arXiv:0802.3893
21 cm lines fluctuations Absorb 21 cm lines from CMB HI 21 cm transitions Emit 21 cm lines to CMB Produce the fluctuations of CMB brightness temperature ! Liner expression of the fluctuations (during the reionisation epoch) The cosmological redshift : 21 line is redshiftd Observing the 21/(1+z) lines, we obtain the redshift slice of Universe !