Download
1 / 11
110 likes | 201 Views
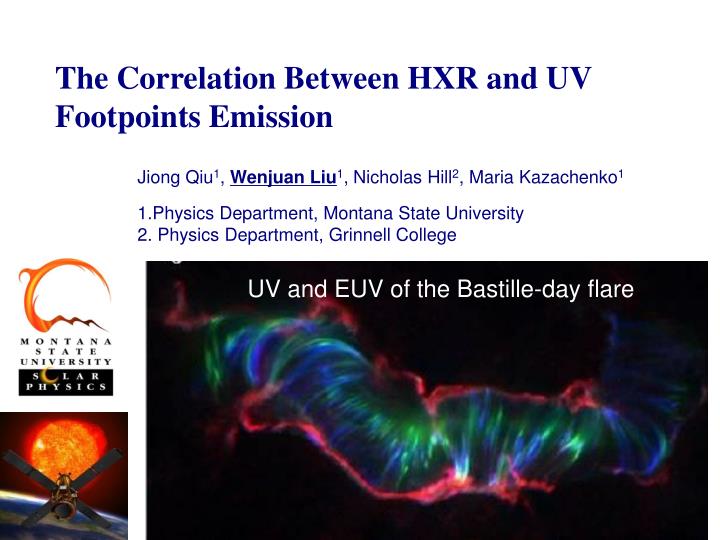
The Correlation Between HXR and UV Footpoints Emission. Jiong Qiu 1 , Wenjuan Liu 1 , Nicholas Hill 2 , Maria Kazachenko 1 Physics Department, Montana State University 2. Physics Department, Grinnell College. UV and EUV of the Bastille-day flare.

E N D
The Correlation Between HXR and UV Footpoints Emission • Jiong Qiu1, Wenjuan Liu1, Nicholas Hill2, Maria Kazachenko1 • Physics Department, Montana State University 2. Physics Department, Grinnell College UV and EUV oftheBastille-day flare
Brightening spreads parallel along the PIL (“zipper effect”) as well as perpendicular to the PIL (e.g. Moore et al. 2001) - not exactly a 2D picture. UV (1600 A) front from TRACE Some Properties: Hard X-ray sources exhibit apparent “motion” as well, but they usually appear as kernels other than ribbons, as has been known and considered as evidence of 3D nature of 2-ribbon flares. HXR (33-53 keV) images from HXT
UV emission rises and peaks along with HXRs, but decays more gradually. • The reconnection rate, inferred from UV images and magnetogram, precedes UV and HXR emissions.
“New” questions from the re-visit: Q1: What is the relationship between UV and hard X-ray emissions in two-ribbon flares? Q2: How is energy release related, or not, to the pattern of magnetic reconnection in an N-dimension ( 3 > N > 2) manner?
Time profiles of UV emission in single pixels (1”x1”) • rapid rise, reaching the peak nearly instantaneously • gradual smooth exponential decay
Gradual “cooling” of UV emission ~5500 pixels ~4500 pixels e-slope decay time: 5-10 minutes
Question: What is the relationship between UV and hard X-ray emissions in two-ribbon flares? • Quick answer: • - simultaneous HXR (> 20keV) and UV emission (rise and peak) by electrons precipitation. • - elongated “cooling” (5-10 min) of UV emission at the same locations but not apparently related to HXR producing process. • the “moving” precipitation along the PIL (at a few tens km/s) and substantial “cooling” time (5-10 min) in the UV band may explain extended UV ribbons. Implication: imaging UV being a proxy of electron precipitation and instantaneous energy release.
ribbon length along PIL HUV ribbon width perpendicular to PIL HUV first phase (0-25 min)
ribbon length along PIL HXR HUV HXR ribbon width perpendicular to PIL HUV second phase (25-45 min)
Such patterns indicate that the reconnection rate may be divided into components due to parallel ( ) and perpendicular expansions ( ), respectively -- organized 2.5D, but wrt PIL. HXR HUV Te Non-thermal emission (HXR and HUV) evolves along with reconnection rate due to perpendicular expansion (reconnection rate in 2D).
Question: How is energy release related to the pattern of magnetic reconnection? Quick answer: in a 2.5D model (as permitted by the organized 2-ribbon evolution), perpendicular expansion of UV ribbons, is strongly correlated with instantaneous (maybe non-thermal) energy release as reflected in radiation signatures. Acknowledgement: we thank Drs. Nightingale, Tarbell, Longcope for discussions. This work is supported by NSF ATM-0748428 and NSF REU program at Montana State University.