Download
1 / 28
280 likes | 413 Views
Imagery for the Nation Cost Benefit Analysis. Federal Geographic Data Committee Steering Committee Meeting May 23, 2007 Shirley Hall Farm Service Agency, U.S. Department of Agriculture & Bill Burgess National States Geographic Information Council (NSGIC).

E N D
Imagery for the NationCost Benefit Analysis Federal Geographic Data Committee Steering Committee Meeting May 23, 2007 Shirley Hall Farm Service Agency, U.S. Department of Agriculture & Bill Burgess National States Geographic Information Council (NSGIC)
What is the Imagery for the Nation Initiative? • Organized effort to acquire imagery over the entire US • Initiated by National State Geographic Information Council • Incorporates current USDA and USGS programs • Includes multi-resolution acquisition (6”, 1’, 1-meter) • Repeat cycles of 1 to 5 years • Imagery stays in public domain • Consistent national standards (e.g. image type, quality & security concerns) • Federal government funds standard products
Current Components of IFTN • Enhanced National Agriculture Imagery Program (NAIP) • Managed by FSA • 1-meter resolution imagery • Collected during the growing season (leaf-on) • Lower 48 States acquired each year • HI and insular territories on 3 year cycle • AK on 5 year cycle (to be acquired by USGS) • Provides for buy-ups (CIR, 4-Band, increased horizontal accuracy)
Current Components of IFTN • USGS managed program • Builds on 133 Cities and other programs • 6 in. and 1ft. imagery resolution • All areas east of Mississippi River and all counties west of Mississippi River with >25 people per square mile (based on initial design) • 3 year cycle • 50% cost share on 6 inch collection • Various buy-up options
Cost Benefit Analysis (CBA) • Funded by USDA and USGS • Conducted by Perot Systems • Managed by a USDA/USGS Steering Committee with NSGIC participation • USGS: George Lee, Dave Roberts, Jim Mauck • FSA: Jim Heald and Shirley Hall • NSGIC: Bill Burgess and Ted Koch • Follows Federal Capital Planning and Investment Control (CPIC) guidelines • Due at the end of June 2007
Cost Benefit Analysis (CBA) • Second task order is being established to include alternatives analysis for 1 ft. program component • Federally funded 50% coverage every three years over entire US (except AK) • 50/50 cost share over the nation every 3 years (except AK) • Due at the end of June 2007
Cost Benefit Analysis (CBA) NOTE: The information discussed today and the slides that are presented are preliminary and are subject to change.
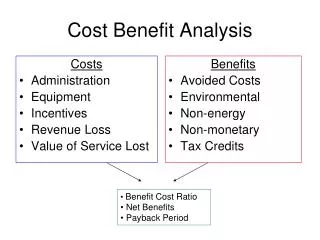
Methodology: Overview Conduct Primary Data Collection Conduct Secondary Data Collection Evaluate Data & Present Results Construct Cost Element Structure (CES) Methodology Design Phased approach: 1- Analysis and Design 2- Study Execution 3- Presentation of Results • Classified costs using best practices • (OMB, USDA, USGS) into the following main categories: • Equipment • Software • Support Services • Personnel • Promotes consistency among data elements in the current and future states. Sought qualitative data using the following steps: 1- Guiding Documents 2- Subject Matter Expert (SME) Interviews 3- Industry Research Sought quantitative data using the following steps: 1- Validate primary data collection via SME surveys 2- Clarify with SME as needed. Evaluated findings: 1- Raw data transferred to Cost Element Structure (CES) 2- Data analyzed and assumptions defined 3- Initial estimate of costs and benefits conducted 4- Findings presented
General Assumptions • Estimates are representative of the survey population only and cost estimation is very conservative • The 10-year Life Cycle Cost estimate is for FY07 through FY16 • The quantitative analysis consists of comparing USDA, USGS, and other programs (Fed, State & Local) costs in the Current and Future States. • “Other Programs (Fed, State & Local)” made up by 643 programs obtained through CBA data collection and NSGIC IFTN Survey. • In the concept of operations the current process for Other Programs (Fed, State & Local) will decrease dramatically in the Future State.
Inputs for the CBA • “In-person” interviews and web-based survey of Federal, state, local and private sector • Program costs from FSA and USGS for current and future states • NSGIC’s 2006 Imagery for the Nation Survey helped to validate and increase sample population.
Questionnaire Survey • Primary Data Collection Tool • Conference Calls / Face-To-Face Interviews • Completion date of 31 January 2007 • Secondary Data Collection Tool • Sent via web link in e-mail • Completion date of 31 January 2007 IFTN CBA Data Collection Tools
CBA Interviews and Surveys • In the data collection phase, the IFTN CBA Team conducted 43 interviews and distributed 42 surveys to Subject Matter Experts from: • Federal, State and Local Governments • Imagery Vendors • Private Industry
Supplemental Data Collection • IFTN CBA Survey – February 2007 • Wanted additional information about total number of current ortho programs. • Wanted more complete cost figures. • Solution: • Integrate the IFTN survey data with the NSGIC survey data to arrive at a baseline for nationwide production costs.
About the NSGIC Survey Data • NSGIC Survey – April 2006 • NSGIC conducted survey via the online survey tool SurveyMonkeytm. • 1,887 respondents encompassing Government, Private Sector, Academia, Associations, etc. completed the survey. • Aimed at obtaining qualitative and quantitative data for orthoimagery programs.
Adding the NSGIC Survey Data • Exported raw data from NSGIC Survey to Excel • Scrubbed data • Eliminated duplicate responses • Sorted respondents into the following three categories: Federal, State and Local • Filtered out Private Sector, Academia, etc. from analysis • Results of Sort: • Federal: 20 of 52 respondents • State: 102 of 345 respondents • Local: 491 of 888 respondents
Adding the NSGIC Survey Data • Defined cost parameters for each group. • NSGIC cost data was presented in ranges. • i.e. $200,000 - $300,000 • The maximum numbers from each range chosen for each cost category, according to best practices. • Less than $25,000 = $25,000 • $25,000-$50,000 = $50,000 • Greater than $400,000 = $400,001
Adding the NSGIC Survey Data • Created a Histogram for each group to better understand the distribution & frequency of the responses. Then solved for the mean of each group. • Incorporated the mean into the Cost Element Structure for the Baseline Production Costs.
Quantitative Benefits Statistical Analysis NSGIC Survey This is an example of the State histogram which allowed the IFTN CBA Team to look at the distribution of responses across each cost category. Subsequent histograms include Federal and Local stakeholder groups.
Quantitative Benefits Statistical Analysis NSGIC Survey Upon completion of the histogram, the IFTN CBA Team applied Descriptive Statistics to the analysis. This provided greater metrics in determining the baseline costs for State programs. This analysis was further extended to the Federal and Local stakeholder groups.
What We Found • Responses from the CBA data collection effort were consistent with those from the NSGIC survey • The IFTN CBA survey results and the NSGIC survey results provided consistent price estimates for local, state, and federal agencies • Able to increase the sample population by combining the results
Comparison of Current & Future States: Total Estimated Program Costs/Benefits A = Current (As-Is) State Costs = $1,917,148,041 B = Future (To-Be) State Costs = $1,439,926,618 A Current (As-Is) State Costs = $1,917,148,041 – B Future (To-Be) State Costs = $1,439,926,618 = C Net Quantifiable Life Cycle Benefits = $477,221,423
Quantitative Benefits – Statistical Analysis Baseline – Current State Costs 10 Year Average Annual Cost: $191,714,804 IFTN – Future State Costs 10 Year Average Annual Cost: $143,992,662 Delta (Current State Costs vs. Future State Costs) 10 Year Average Annual Savings: $47,722,142
Being VERY Conservative • Ensured duplicate survey information was scrubbed • Only using ACTUAL results from surveys - not attempting to extrapolate across the country • Including a realistic phase-in and program adoption rate in financial calculations • Striving to be “bullet proof”
Example of Phase-in & Adoption Total Government Production Three Year Program Phase-in State & Local Adoption
Adding Alternatives to Deal with Western States Equity Concerns • Option 1 – 1’ program is 50/50 cost share across the entire nation – Requires cost-share • Option 2 – 1’ program is 50% coverage every three years, paid by federal program, and directed by statewide business plans – Does not require cost-share
CBA - What’s Next • Second task order established for “alternatives”. • FGDC Steering Committee to receive preliminary briefing. • Distribute CBA after deliverable acceptance (July timeframe). • Incorporate results into Business Plan and ongoing subcommittee activities
What is Needed for IFTN Planning to Progress • NDOP needs to meet with an Executive Committee from SC agencies • Provide a full briefing on CBA and program issues • Executive Committee needs to develop funding strategies and assist with implementation