Download
1 / 16
160 likes | 315 Views
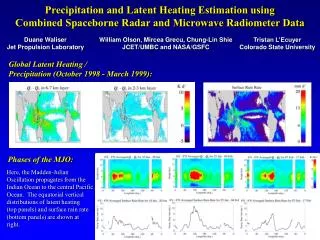
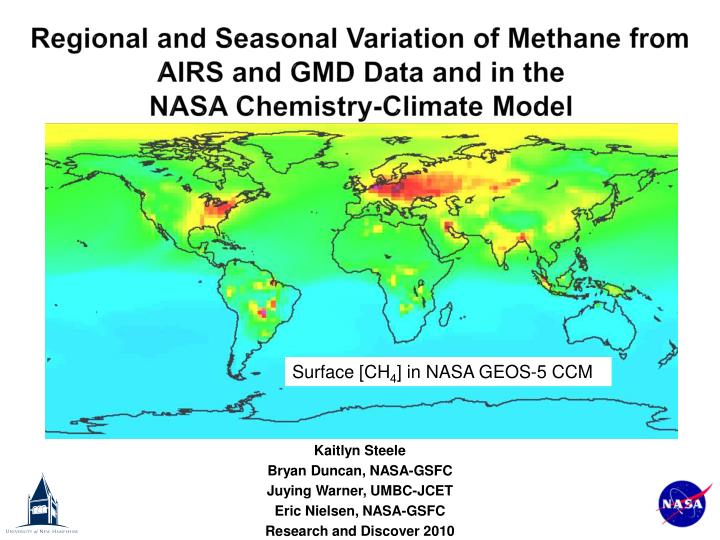
Regional and Seasonal Variation of Methane from AIRS and GMD Data and in the NASA Chemistry-Climate Model. Kaitlyn Steele Bryan Duncan, NASA-GSFC Juying Warner, UMBC-JCET Eric Nielsen, NASA-GSFC Research and Discover 2010. Surface [CH 4 ] in NASA GEOS-5 CCM. Methane Sources.

E N D
Regional and Seasonal Variation of Methane from AIRS and GMD Data and in the NASA Chemistry-Climate Model Kaitlyn Steele Bryan Duncan, NASA-GSFC Juying Warner, UMBC-JCET Eric Nielsen, NASA-GSFC Research and Discover 2010 Surface [CH4] in NASA GEOS-5 CCM
Methane Sources * ~80% from methanogenesis Sources: *Bacterial methanogenesis: CH3COOH CH4 + CO2 CO2 +4 H2 CH4 +2 H2O Thermogenic production Incomplete combustion Tropospheric lifetime: τ~ 8-9 years Sinks: Methane oxidation in soil & water: CH4 + 2 O2 CO2 + 2 H2O Oxidation by OH radical: OH + CH4 H2O + CH3 Stratospheric reaction with Cl: CH4 + Cl CH3 + HCl Wang et al. 2004
Annual Methane Source Distribution Coal, municipal waste Latitude Longitude Swamps, biomass burning, biofuel Rice, animals, biofuel
Variability of Atmospheric Methane at Surface • No definitive explanation regarding slowdown in CH4 growth rate • Several hypotheses • Increase in OH • Reduced emissions, especially from Soviet Union • Renewed growth • Decrease in OH influenced by solar cycle • Economic growth of developing countries
Methods of Monitoring Methane In situ NOAA ESRL Global Monitoring Division (GMD) Surface level Japanese Airline Data (JAL) Troposphere Satellite Atmospheric Infrared Sounder (AIRS) on EOS/Aqua Hyperspectral scan with 200 channels in 7.66 μm absorption band of CH4, of which 71 used to retrieve CH4 Most sensitive in middle and upper troposphere (~300 mb) (Xiong et al. 2008) Modeling GEOS-5 Chemistry-climate model (CCM) http://aqua.nasa.gov/about/instrument_airs.php
GEOS-5 CCM: Source Contributions to Total Methane Canada Hungary Hawaii Guam Antarctica
GEOS-5 CCM: Methane in Upper Troposphere (UT): Surface Sources in Relation to Areas of Deep Convection CCM rainfall as a proxy for deep convection July CH4 animals CH4 energy
October CH4 rice production CH4 biomass burning
GEOS-5 CCM: Seasonal Variability in UT: Wetland Source Strong wetland source January April CH4 from other sources July October
Seasonal Variability Observed by AIRS ~ 350 mb CH4 “poor” air at surface lofted to UT NASA Global Precip. Climatology Project Rainfall Feb (ppbv) Feb July July
Conclusions • All methods for monitoring CH4have strengths and limitations, so we used a suite of observations (i.e., GMD, JAL, AIRS) in conjunction with the GEOS-5 CCM • Can AIRS (UT ~ 300 mb) help us identify variation in methane sources? It is difficult to constrain methane’s sources, particularly from space, because: 1) methane’s long lifetime results in a large background concentration 2) there are many methane sources that are often overlapping in their distribution • Using the GEOS-5 CCM, we found: • Variability in CH4 at surface influenced by location of site with respect to sources of CH4 • Variability in CH4in UT caused by seasonal variation in sources convolved with seasonal variation in deep convection
Acknowledgements Bryan Duncan Juying Warner Eric Nielsen Yasuko Yoshida Xiaohua Pan Zigang Wei Research & Discover
References • Wang, J.S., J.A. Logan, M.B. McElroy, B.N. Duncan, I.A. Megretskaia, and R.M. Yantosca. 2004. A 3-D model analysis of the slowdown and interannual variability in the methane growth rate from 1988 to 1997. Global Biogeochemical Cycles. 18: GB3011, doi:10.1029/2003GB2180 • Xiong, X., C. Barnet, E. Maddy, C. Sweeney, X. Liu, L. Zhou, and M. Goldberg. 2008. Characterization and validation of methane products from the Atmospheric Infrared Sounder (AIRS). J. Geophys. Res. 113: G00A01, doi:10.1029/2007JG000500 http://aqua.nasa.gov/science/formation_flying.php


![Workshop Objectives [ Eric A. Smith -- NASA/GSFC ]](https://cdn2.slideserve.com/4436479/slide1-dt.jpg)