Download
1 / 41
410 likes | 498 Views
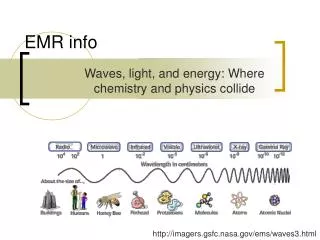
Image courtesy of NASA/GSFC. Climate Change: Use of Climate Science in Decision-making. Eugene S. Takle Professor of Atmospheric Science Department of Geological and Atmospheric Sciences Professor of Agricultural Meteorology Department of Agronomy

E N D
Climate Change: Use of Climate Science in Decision-making Eugene S. Takle Professor of Atmospheric Science Department of Geological and Atmospheric Sciences Professor of Agricultural Meteorology Department of Agronomy Faculty Director, University Honors Program Iowa State University Ames, Iowa 50011 gstakle@iastate.edu Ames High School 6 December 2007
Outline • Changes in atmospheric carbon dioxide • Radiative forcing • Simulations of global climate and future climate change • Climate change for Iowa and the Midwest: adaptation strategy Except where noted as personal views or from the ISU Global Change course or the Iowa Environmental Mesonet, all materials presented herein are from peer-reviewed scientific reports
CO2, CH4 and temperature records from Antarctic ice core data Source:Vimeux, F., K.M. Cuffey, and Jouzel, J., 2002, "New insights into Southern Hemisphere temperature changes from Vostok ice cores using deuterium excess correction", Earth and Planetary Science Letters, 203, 829-843.
CO2, CH4 and temperature records from Antarctic ice core data Source:Vimeux, F., K.M. Cuffey, and Jouzel, J., 2002, "New insights into Southern Hemisphere temperature changes from Vostok ice cores using deuterium excess correction", Earth and Planetary Science Letters, 203, 829-843. Pattern repeats about every 100,000 years Natural cycles
Carbon Dioxide and Temperature 2007 380 ppm
Carbon Dioxide and Temperature 2050 550 ppm
Carbon Dioxide and Temperature “Business as Usual” 950 ppm
Carbon Dioxide and Temperature “Business as Usual” 950 ppm ?
http://www.ncdc.noaa.gov/img/climate/research/2006/ann/glob_jan-dec-error-bar_pg.gifhttp://www.ncdc.noaa.gov/img/climate/research/2006/ann/glob_jan-dec-error-bar_pg.gif
Source: IPCC, 2001: Climate Change 2001: The Scientific Basis
Source: IPCC, 2001: Climate Change 2001: The Scientific Basis
El Chichon (1982) Agung, 1963 Mt. Pinatubo (1991) At present trends the imbalance = 1 Watt/m2 in 2018 Hansen, Scientific American, March 2004
http://www.nytimes.com/interactive/2007/10/01/science/20071002_ARCTIC_GRAPHIC.html?ex=1191902400&en=c94928ddecd5ba57&ei=5070&emc=eta3http://www.nytimes.com/interactive/2007/10/01/science/20071002_ARCTIC_GRAPHIC.html?ex=1191902400&en=c94928ddecd5ba57&ei=5070&emc=eta3
http://www.nytimes.com/interactive/2007/10/01/science/20071002_ARCTIC_GRAPHIC.html?ex=1191902400&en=c94928ddecd5ba57&ei=5070&emc=eta3http://www.nytimes.com/interactive/2007/10/01/science/20071002_ARCTIC_GRAPHIC.html?ex=1191902400&en=c94928ddecd5ba57&ei=5070&emc=eta3
http://www.nytimes.com/interactive/2007/10/01/science/20071002_ARCTIC_GRAPHIC.html?ex=1191902400&en=c94928ddecd5ba57&ei=5070&emc=eta3http://www.nytimes.com/interactive/2007/10/01/science/20071002_ARCTIC_GRAPHIC.html?ex=1191902400&en=c94928ddecd5ba57&ei=5070&emc=eta3
http://www.nytimes.com/interactive/2007/10/01/science/20071002_ARCTIC_GRAPHIC.html?ex=1191902400&en=c94928ddecd5ba57&ei=5070&emc=eta3http://www.nytimes.com/interactive/2007/10/01/science/20071002_ARCTIC_GRAPHIC.html?ex=1191902400&en=c94928ddecd5ba57&ei=5070&emc=eta3
http://www.nytimes.com/interactive/2007/10/01/science/20071002_ARCTIC_GRAPHIC.html?ex=1191902400&en=c94928ddecd5ba57&ei=5070&emc=eta3http://www.nytimes.com/interactive/2007/10/01/science/20071002_ARCTIC_GRAPHIC.html?ex=1191902400&en=c94928ddecd5ba57&ei=5070&emc=eta3
Source: Corell, R. W., 2004: Impacts of a warming Arctic. Arctic Climate Impact Assessment (www.acia.uaf.edu) Cambridge University Press (www.cambridge.org).
Kennedy Space Center Impact of a 1-m rise in sea level on low-lying areas Projected sea-level rise In 21st century: 0.5 to 1.0 m Areas subjected to Inundation with a 1 m (~3 ft) rise in sea level Miami Source: Corell, R. W., 2004: Impacts of a warming Arctic. Arctic Climate Impact Assessment (www.acia.uaf.edu) Cambridge University Press (www.cambridge.org).
An exhibition of old and new photographs at the Swiss Alpine Museum in Bern documents the gradual disappearance of Switzerland's glaciers. The Rhone glacier with the Hotel Belvedere in the foreground and the Furka pass, Canton Valais circa 1906 and 2003 (Pictures: Gesellschaft fur okologische Forschung, Munich)
http://www.ncdc.noaa.gov/img/climate/research/2006/ann/glob_jan-dec-error-bar_pg.gifhttp://www.ncdc.noaa.gov/img/climate/research/2006/ann/glob_jan-dec-error-bar_pg.gif
Natural and anthropogenic contributions to global temperature change (Meehl et al., 2004). Observed values from Jones and Moberg 2001. Grey bands indicate 68% and 95% range derived from multiple simulations.
Natural and anthropogenic contributions to global temperature change (Meehl et al., 2004). Observed values from Jones and Moberg 2001. Grey bands indicate 68% and 95% range derived from multiple simulations. Natural cycles
Natural and anthropogenic contributions to global temperature change (Meehl et al., 2004). Observed values from Jones and Moberg 2001. Grey bands indicate 68% and 95% range derived from multiple simulations. Not Natural
Natural and anthropogenic contributions to global temperature change (Meehl et al., 2004). Observed values from Jones and Moberg 2001. Grey bands indicate 68% and 95% range derived from multiple simulations. Highly Likely Not Natural Not Natural
Source: Jerry Meehl, National Center for Atmospheric Research
Energy intensive Reduced Consumption Energy conserving IPCC Fourth Assessment Report Summary for Policy Makers
Energy intensive Reduced Consumption Energy conserving The planet is committed to a warming over the next 50 years regardless of political decisions IPCC Fourth Assessment Report Summary for Policy Makers
Energy intensive Reduced Consumption Energy conserving Mitigation Possible Adaptation Necessary IPCC Fourth Assessment Report Summary for Policy Makers
Projected Changes for the Climate of Iowa/Midwest (My tentative assessment) • Longer frost-free period (high) • Higher average winter temperatures (high) • Fewer extreme cold temperatures in winter (high) • More extreme high temperatures in summer (medium) • Higher nighttime temperatures both summer and winter (high) • More (~10%) precipitation (medium) • More variability of summer precipitation (high) • More intense rain events and hence more runoff (high) • Higher episodic streamflow (medium) • Longer periods without rain (medium) • Higher absolute humidity (high) • Stronger storm systems (medium) • Reduced annual mean wind speeds (medium) Follows trend of last 25 years and projected by modelsNo current trend but model suggestion or current trend but models inconclusive
Summary • Climate change of the past 35 years is not consistent with natural variations over the last 400,000 years • Evidence clearly shows that radiative forcing due to anthropogenic greenhouse gases has contributed over half of the warming of the last 35 years • Mitigation efforts, although urgently needed, will have little effect on global warming until the latter half of the 21st century • Adaptation strategies should be developed for the next 50 years • Recent trends and model projections should be used to develop adaptation strategies for the next 10 years EST personal view
For More Information • For peer-reviewed evidence supporting everything you have seen in this presentation, see my online Global Change course: http://www.meteor.iastate.edu/gccourse • Contact me directly: gstakle@iastate.edu • Current research on regional climate and climate change is being conducted at Iowa State Unversity under the Regional Climate Modeling Laboratory http://rcmlab.agron.iastate.edu/ • North American Regional Climate Change Assessment Program http://www.narccap.ucar.edu/ • For this and other climate change presentations see my personal website: http://www.meteor.iastate.edu/faculty/takle/ Or just Google Eugene Takle


![How to Create a LinkedIn Company Page that Converts [VISUAL GUIDE]](https://cdn4.slideserve.com/7374801/slide1-dt.jpg)