Download

1 / 64
640 likes | 644 Views
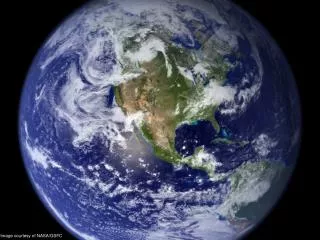
Image courtesy of NASA/GSFC. Global Climate Change: How We Got Here, and What Do We Do Now?. Eugene S. Takle Professor of Atmospheric Science Department of Geological and Atmospheric Sciences Professor of Agricultural Meteorology Department of Agronomy Iowa State University

E N D
Global Climate Change: How We Got Here, and What Do We Do Now? Eugene S. Takle Professor of Atmospheric Science Department of Geological and Atmospheric Sciences Professor of Agricultural Meteorology Department of Agronomy Iowa State University Ames, Iowa 50011 gstakle@iastate.edu Westminster Presbyterian Church Des Moines 22 January 2008
Outline • Scientific basis for climate change • Climate change and the scientific process • Moving beyond the science to take action • What do we do now? • Mitigation • Adaptation • Summary
CO2, CH4 and temperature records from Antarctic ice core data Source:Vimeux, F., K.M. Cuffey, and Jouzel, J., 2002, "New insights into Southern Hemisphere temperature changes from Vostok ice cores using deuterium excess correction", Earth and Planetary Science Letters, 203, 829-843.
CO2, CH4 and temperature records from Antarctic ice core data Source:Vimeux, F., K.M. Cuffey, and Jouzel, J., 2002, "New insights into Southern Hemisphere temperature changes from Vostok ice cores using deuterium excess correction", Earth and Planetary Science Letters, 203, 829-843. Pattern repeats about every 100,000 years Natural cycles
Carbon Dioxide and Temperature “Business as Usual” 950 ppm (2100)
http://www.ncdc.noaa.gov/img/climate/research/2006/ann/glob_jan-dec-error-bar_pg.gifhttp://www.ncdc.noaa.gov/img/climate/research/2006/ann/glob_jan-dec-error-bar_pg.gif
Source: IPCC, 2001: Climate Change 2001: The Scientific Basis
Source: IPCC, 2001: Climate Change 2001: The Scientific Basis
El Chichon (1982) Agung, 1963 Mt. Pinatubo (1991) At present trends the imbalance = 1 Watt/m2 in 2018 Hansen, Scientific American, March 2004
http://www.ncdc.noaa.gov/img/climate/research/2006/ann/glob_jan-dec-error-bar_pg.gifhttp://www.ncdc.noaa.gov/img/climate/research/2006/ann/glob_jan-dec-error-bar_pg.gif
Natural and anthropogenic contributions to global temperature change (Meehl et al., 2004). Observed values from Jones and Moberg 2001. Grey bands indicate 68% and 95% range derived from multiple simulations.
Natural and anthropogenic contributions to global temperature change (Meehl et al., 2004). Observed values from Jones and Moberg 2001. Grey bands indicate 68% and 95% range derived from multiple simulations. Natural cycles
Natural and anthropogenic contributions to global temperature change (Meehl et al., 2004). Observed values from Jones and Moberg 2001. Grey bands indicate 68% and 95% range derived from multiple simulations. Not Natural
Source: Jerry Meehl, National Center for Atmospheric Research
Skeptics’ Arguments • It's the sun 9.0% • Climate's changed before 7.8% • There is no consensus 6.4% • Surface temp is unreliable 5.8% • Models are unreliable 4.5% • Al Gore got it wrong 4.4% • Ice age predicted in the 70's 4.0% • CO2 lags temperature 3.7% • Mars is warming 3.3% • Global warming is good 3.3%
Energy intensive Reduced Consumption Energy conserving IPCC Fourth Assessment Report Summary for Policy Makers
Energy intensive Reduced Consumption Energy conserving The planet is committed to a warming over the next 50 years regardless of political decisions IPCC Fourth Assessment Report Summary for Policy Makers
Energy intensive Reduced Consumption Energy conserving The planet is committed to a warming over the next 50 years regardless of political decisions IPCC Fourth Assessment Report Summary for Policy Makers
Energy intensive Reduced Consumption Energy conserving The planet is committed to a warming over the next 50 years regardless of political decisions IPCC Fourth Assessment Report Summary for Policy Makers
Energy intensive Reduced Consumption Energy conserving Mitigation Possible Adaptation Necessary IPCC Fourth Assessment Report Summary for Policy Makers
Observed summer (June-July-August) daily mean temperature changes (K) between 1976-2000 (Adapted from Folland et al. [2001]).
“Warming Hole” DTmax (JJA) ˚C • Pan, Z., R. W. Arritt, E. S. Takle, W. J. Gutowski, Jr., C. J. Anderson, and M. Segal, 2004: Altered hydrologic feedback in a warming climate introduces a “warming hole”. Geophys. Res. Lett.31, L17109, doi:10.1029/2004GL020528.
Precipitation minus Evaporation for Western US (25N-40N, 95W-125 W) R. Seager, et al., 2007. Model Projections of an Imminent Transition to a More Arid Climate in Southwestern North America. Science, Vol. 316. no. 5828, pp. 1181 - 1184
Precipitation minus Evaporation for Western US (25N-40N, 95W-125 W) R. Seager, et al.,2007. Model Projections of an Imminent Transition to a More Arid Climate in Southwestern North America. Science, Vol. 316. no. 5828, pp. 1181 - 1184
Precipitation minus Evaporation for Western US (25N-40N, 95W-125 W) Colorado River Compact established, 1922 R. Seager, et al.,2007. Model Projections of an Imminent Transition to a More Arid Climate in Southwestern North America. Science, Vol. 316. no. 5828, pp. 1181 - 1184
Intergovernmental Panel on Climate Change (IPCC) • Created in 1988 by the World Meteorological Organization (UN) and the United Nations Environmental Programme • IPCC purpose is to evaluate the state of climate science as a basis for informed policy action, primarily on the basis of peer-reviewed and published scientific literature
NAS Assessment of IPCC Conclusions • “Greenhouse gases are accumulating in the Earth’s atmosphere as a result of human activities, causing surface air temperatures to rise and sub-surface ocean temperatures to rise” • “The IPCC’s conclusion that most of the observed warming of the last 50 years is likely to have been due to the increase in greenhouse gas concentrations accurately reflects the current thinking of the scientific community on this issue” National Academy of Sciences Committee on the Science of Climate Change, 2001: Climate change science: An analysis of some key questions. National Academy Press.
IPCC AR4 (2007) Process • IPCC does not conduct its own research. It simply organizes teams of scientists to evaluate the current state of scientific knowledge • People from over 130 countries contributed to the IPCC Fourth Assessment Report over the previous 6 years. • These people included more than 2500 scientific expert reviewers, more than 850 contributing authors, and more than 450 lead authors
IPCC AR4 Conclusions • Warming of the climate system is unequivocal. • Most of (>50% of) the observed increase in globally averaged temperatures since the mid-20th century is very likely (confidence level >90%) due to the observed increase in anthropogenic (human) greenhouse gas concentrations. • Hotter temperatures and rises in sea level "would continue for centuries" even if greenhouse gas levels are stabilized, although the likely amount of temperature and sea level rise varies greatly depending on the fossil intensity of human activity during the next century.
IPCC AR4 Conclusions • The probability that this is caused by natural climatic processes alone is less than 5%. • World temperatures could rise by between 1.1 and 6.4 °C (2.0 and 11.5 °F) during the 21st century and that: • Sea levels will probably rise by 18 to 59 cm (7.08 to 23.22 in). • There is a confidence level >90% that there will be more frequent warm spells, heat waves and heavy rainfall.
IPCC AR4 Conclusions • There is a confidence level >66% that there will be an increase in droughts, tropical cyclones and extreme high tides. • Both past and future anthropogenic carbon dioxide emissions will continue to contribute to warming and sea level rise for more than a millennium. • Global atmospheric concentrations of carbon dioxide, methane, and nitrous oxide have increased markedly as a result of human activities since 1750 and now far exceed pre- industrial values over the past 650,000 years