Download
1 / 17
170 likes | 321 Views
Competitive Industry in the Long Run. The case of a constant cost industry. In our story here with a constant cost industry it is assumed that 1) All firms are identical and thus all have the same identical cost curves, and

E N D
Competitive Industry in the Long Run The case of a constant cost industry
In our story here with a constant cost industry it is assumed that 1) All firms are identical and thus all have the same identical cost curves, and 2) Those cost curves do not change as the industry expands or contracts (although the cost curves could change for other reasons). The author points out that assumption 1 likely holds in industries that do not require special skills. Fast food joints might fit the bill here, while gourmet restaurants probably don’t. Assumption 2 will hold in industries that are not large enough to affect the price of any input. This means that as the number of firms in the industry changes the price of inputs will stay the same because the industry is not a relatively large user of the input – other industries use the input as well.
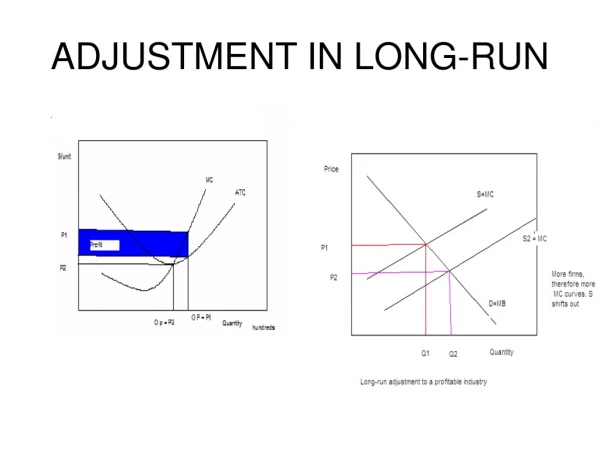
In competition it is assumed that in the long run any firm that wants can enter or exit the industry. Furthermore, If profit >0 for existing firms, more firms will enter, If profit < 0 for existing firms, existing firms will exit, and If profit = 0 there is no incentive for more firms to enter or existing firms to exit.
Useful diagram P D1 S1 ATC1 MC1 P1 P=MR1 Q q Q1 q1 Market Firm
Hey, check this out. Produce the q where MR = MC and see what type of profit exists by looking at (P - ATC) times Q or TR-TC at the q mentioned. Profit = TR – TC. PQ = TRATC times Q = (TC/Q) times Q = TC (P-ATC) times Q = PQ - (ATC times Q) = TR - TC
Notes about diagram Market In the market the price is determined by the interaction of supply and demand. When you think about the supply curve, there are a certain number of firms involved. You can think of this as being the short run where the amount of capital is fixed for each seller. In the short run, then, no new firms can enter either because they can’t get more capital either.
increase demand On the next screen you will see demand increase in the market. Imagine consumers demand more. Then, 1) The price in the market will increase to P2, 2) The MR(price) for the firm will rise to MR2, 3) The output of the firm will expand to q2, 4) The firm will have profit given by the shaded rectangle.
increase demand P D2 D1 S1 ATC1 MC1 P2 P2 = MR2 P1 P1=MR1 Q q Q1 q1 q2 Market Firm
demand increase In the short run when the demand increases, existing firms find it worthwhile to produce more, but they can not expand the production facility, by definition, and other firms can not enter the industry. The profit that exists in the short run are enjoyed by the firms in the industry. But in the long run other firms can enter the industry, as well as have existing firms expand their production facility. In the long run we want to note 1) what impact profit has on firms and 2) what happens to input prices.
profit impact In the long run positive economic profit attracts firms to the industry. Firms will enter the industry until profit is driven to zero. The presence of economic losses(negative profits) forces some firms to leave the market. Firms will exit until the profit is zero.
input prices By definition in economics, resources are scarce. In the context of increasing demand for output we want to think about what might to the price of inputs. We consider three cases. 1) Inputs are relatively abundant and thus there is no increase in input prices as the demand for inputs increases. This is called a constant cost industry. 2) Inputs are in relative short supply and thus there is an increase in input prices as the demand for inputs increases. This is called an increasing cost industry. 3) Inputs can be used in new ways and thus there is a decrease in input prices. This is called a decreasing cost industry.
ideas to come Now, if a firm has positive economic profit we will see 1) firms enter the market and thus market price falls, and 2) the firms cost curves may shift if input prices change. This will have an impact on how much the supply curve shifts.
no change in input prices P D2 D1 S1 ATC1 MC1 S2 P2 P2 = MR2 P1 P1=MR1 Q q Q1 Q2 q1 q2 Market Firm
no change in input prices Since there is no change in input prices in this example profit will again be zero when the supply shifts out as far as the new demand to return the price to P1. Supply S1 had a certain amount of firms involved and then some more firms entered(when profit was positive) to give us a certain amount of firms involved with S2. So there really is a separate supply curve for each specific number of firms in the industry. So in the long run we have variation in the number of firms in the industry, depending on the level of demand.
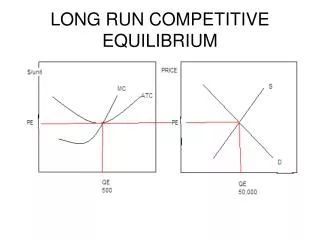
Long run supply curve The long run supply curve in the market shows us the price and quantity combinations where 1) the number of firms adjusts, and 2) profit is zero. On the slide two screens ago we see the same price, P1, but two levels of output, Q1 and Q2. Since input prices didn’t change, P1 will always be the price that results in zero profit. On the following screen you will see the long run supply curve in the market in this constant cost case.
no change in input prices P D2 D1 S1 ATC1 MC1 S2 P2 P2 = MR2 P1 P1=MR1 Q q Q1 Q2 q1 q2 Market long run supply Firm
Summary In a constant cost industry in the long run 1) The supply curve in the industry is horizontal, 2) The supply curve is horizontal at the break-even price, 3) Each firm makes the amount where MR = MC, and P = AC. Now, Since MR = P for firms in comp., we also conclude P = MC and since at break-even MC =AC, P = AC. SO, P = MR = MC = AC at the profit maximizing level of output for each firm in the industry. This is all a result of firms attempting to or aiming to maximize profit.