Download
1 / 34
340 likes | 676 Views
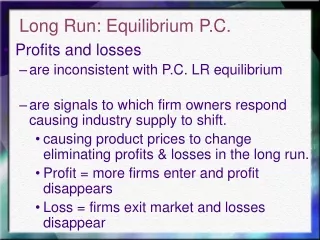
LONG RUN. A period of time over which the number of firms in an industry can change their production facilities. In the long run, firms can enter or leave an industry, and existing firms can modify their facilities or build new facilities.

E N D
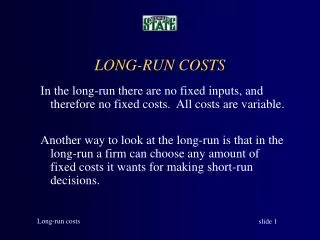
LONG RUN A period of time over which the number of firms in an industry can change their production facilities. In the long run, firms can enter or leave an industry, and existing firms can modify their facilities or build new facilities. • The time required for a firm to build a production facility and start producing output. • The long run varies across industries.
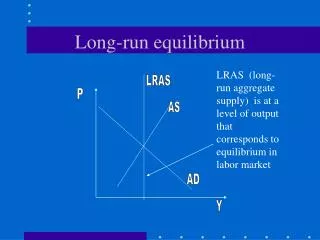
LONG-RUN SUPPLY CURVE • Shows the relationship between price and quantity supplied over a period of time long enough that firms can enter or leave the market and firms can modify their production facilities.
Chair Industry Output and Average Production Cost Number Industry Chairs Total Average of firms Output per Cost for Cost Per Firm Firm Chair 25 500 20 $400 $20 50 1,000 20 $480 $24 75 1,500 20 $560 $28 The average cost of chair industry increases as the industry grows for two reasons:
Reasons Average Cost Grows As Industry Grows • Increasing Input Prices As an industry grows, it competes with other industries for limited amounts of various inputs; this competition drives up the prices of these inputs. • Less Productive Inputs A small industry only uses the most productive inputs, but as the industry grows, firms may be forced to use less productive inputs.
Drawing the long-run supply curve Market Initial Short-Run Supply Firm Price SMC MR2 9.00 9.00 New Short-Run Supply SATC2 Profit SATC1 6.00 6.00 MR3 MR1 5.00 5.00 New Demand Long-Run Supply Initial Demand 10 14 22 10 11 14 Quantity Quantity (thousands)
The Long-Run Market Supply Curve • How much output produced at each price. • Determine the total output of the industry by multiplying the output per firm by the number of firms in the industry.
Determining Number of Firms in an Industry • Whenever opportunity to make profit - price exceeds average cost - firms enter market. • Firms continue to enter until economic profit is zero. • To find number of firms in the market, find the quantity of chairs at which average cost equals market price.
The Long-Run Market Supply Curve 28 i Price of Chairs $ 24 h 20 e 500 1,000 1,500 Chairs Per Hour
The Long-Run Supply Curve The preceding long-run supply curve: • Is positively sloped. • The higher the price of chairs, the larger the quantity supplied. • An increase in the price of chairs makes chair production more profitable, so • firms enter the market, • increasing the total output of the industry.
Increasing-Cost Industry An industry with a positively-sloped long-run supply curve. • Indicates average cost of production increases as industry grows. • Supply curve will be relatively steep if average cost increases rapidly as industry grows. • With rapidly increasing average cost, a relatively large increase in price is needed to get firms to produce more output.
The Long-Run Market Supply Curve For a Constant-Cost Industry Price of Taxi Service $ per mile TAXI TAXI TAXI 3 Long-Run Supply Curve 1,000 2,000 Miles of Taxi Service Per Hour
Constant-Cost Industries An industry with a horizontal long-run supply curve. • Indicates average cost of production is constant. • It can continue to buy inputs at the same prices, and these inputs are as productive as inputs in the smaller industry. • Industry must be small part of relative input markets: industry does not affect the prices of inputs.
Decreasing-Cost Industry An industry with a negatively-sloped long-run supply curve. • The average cost of production decreases as the industry expands.
Short-Run versus Long-Run Supply Curves • Long-run response to change in price is much greater than short-run response. • The long-run supply curve is much flatter than the short run curve, meaning that the quantity of chairs increases by a larger amount in the long run. • The short-run supply curve is much steeper than the long-run supply curve because there are diminishing returns in the short run.
Long-Run versus Short-Run Market Supply Curve Long-Run Supply Curve Short-Run Supply Curve j Price of Chairs $ 28 i h 24 PRICE $24 $28 SHORT RUN # of Firms 50 50 Chairs by 1 firm 20 22 Chairs by all firms 1,000 1,100 LONG RUN # of Firms 50 75 Chairs by 1 firm 20 20 Chairs by all firms 1,000 1,500 1,000 1,100 1,500 Chairs Per Hour
Long-Run versus Short-Run Market Supply Curve Price elasticity of supply measures difference between short-run and long-run responses to change in price: • Change in price = 16.67% = 4/24 • Short-run change in quantity = 10% = 100/1000 • Short-run price elasticity of supply = 0.60 • Long-run change in quantity = 50% = 500/1000 • Long-run price elasticity of supply = 3.00
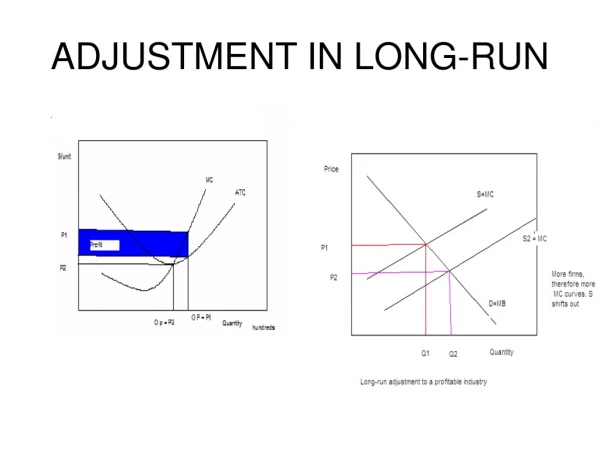
Effects of Increased Demand • Increased demand results in rightward shift in demand curve, causing a shortage at the original price: quantity demand exceeds quantity supplied at the original price. In Short Run • The number of firms is fixed, • Supply curve is relatively steep, • Price increases by large amount, In Long Run • Firms can enter market, • Supply curve is relatively flat, • Price increases by small amount .
Short-Run and Long-Run Effects of an Increased Demand for Video Rentals Price of Video Rentals $ Per Night Short-Run Supply s 6.00 New Demand Initial Demand Long-Run Supply f 2.15 Price Quantity 2.00 i $2.00 10 Short Run Change $6.00 14 Long Run Change $2.15 22 10 14 22 Quantity: Thousands of Video Rentals per Day
Relationship between long-run and short-run cost curves SATC1 SATC3 SATC2 SMC1 Long-run average cost (LAC) Dollars per unit 11 10 150 100 300 Units of output
Relationship between LAC and LMC • Long-run marginal cost is the change in total cost resulting from producing an extra unit of output in the long-run. • When LAC is downward-sloping, LMC must lie below LAC. • When LAC is horizontal, LMC and LAC are equal.
Relationship between long-run and short-run cost curves Long-run average cost (LAC) Dollars per unit 10 Long-run marginal cost (LMC) 150 100 300 Units of output
MONOPOLY An industry served by a single firm. Occurs when some barrier to entry exists, preventing other firms from entering the market. • PATENT -- Granted by the government, giving an inventor exclusive right to sell a new product for some period of time. • Government implicitly grants monopoly power. For example, government permits major league baseball to restrict the number and location of teams.
BARRIERS TO ENTRY • FRANCHISE or LICENSING SCHEME -- Government designates single firm to sell a particular good: • Off-street parking; • National Park Food Concessions; • Radio and TV FCC licensing. • NATURAL MONOPOLY -- Economies of Scale Single firm would be profitable; a pair of firms would lose money; Second firm would make price less than average cost.
THEMONOPOLIST’SOUTPUT DECISION How much output to produce at what price. Objective is to maximize profits: The difference between total revenue and total cost.
TOTAL AND MARGINAL REVENUE • Total Revenue --- Price times the quantity sold. • Marginal Revenue --- The change in total revenue that results from selling one more unit of output.
PRICE QUANTITY TOTAL MARGINAL SOLD REVENUE REVENUE $16 0 0 --- $14 1 $14 $14 $12 2 $24 $10 $10 3 $30 $6 $8 4 $32 $2 $6 5 $30 -$2 $4 6 $24 -$6 QUANTITY SOLD QUANTITY SOLD 14 PRICE $$ 12 10 8 DEMAND 6 4 2 QUANTITY SOLD -2 1 2 3 4 5 6 -4 -6 MARGINAL REVENUE
DEMAND, TOTAL REVENUE AND MARGINAL REVENUE PRICE QUANTITY SOLD TOTAL REVENUE MARGINAL REVENUE $16 0 0 --- $14 1 $14 $14 $12 2 $24 $10 $10 3 $30 $6 $8 4 $32 $2 $6 5 $30 -$2 $4 6 $24 -$6
PRICE $$ b 14 c 12 MONOPOLIST’S DEMAND ( MARKET DEMAND ) d 10 h e 8 f 6 i g 4 2 MARGINAL REVENUE 0 QUANTITY SOLD 1 2 3 4 5 6 - 2 j - 4 - 6 k
THE MARGINAL PRINCIPLE Increase the level of an activity if its marginal benefit exceeds its marginal cost, but reduce the level if the marginal cost exceeds the marginal benefit. If possible, pick the level at which the marginal benefit equals the marginal cost. MARGINAL REVENUE = MARGINAL COST
USING MARGINAL PRINCIPLE TO PICK PRICE AND QUANTITY PRICE QUANTITY MARGINAL MARGINAL SOLD REVENUE COST $18 600 $12 $6 $17 700 $10 $6 $16 800 $8 $6 $15 900 $6 $6 $14 1,000 $4 $6 $13 1,100 $2 $6 $12 1,200 $0 $6
USING MARGINAL PRINCIPLE TO PICK PRICE AND QUANTITY PRICE $$ 24 22 20 h 18 m 16 14 i 12 LONG-RUN MARGINAL COST EQUALS LONG-RUN AVERAGE COST 10 PROFIT = $8,100 8 n 6 4 MARKET DEMAND CURVE 2 MARGINAL REVENUE 200 400 600 800 1000 1200 1400 1600 1800 2000 DOSES OF DRUG PER HOUR
CALCULATING MARGINAL REVENUE • Marginal Revenue = Current Total Revenue - Previous Total Revenue = Initial Price - [ Initial Quantity * Slope of Demand Curve ]
MONOPOLY VERSUS PERFECT COMPETITION PRICE Market Demand Curve C m $15 M D Long-run average cost and market supply curve p $6 900 1,800 Doses of Drug per hour
DEADWEIGHT LOSS • Net loss associated with a monopoly (D). • Monopoly is inefficient because it generates less output than a perfectly competitive market.