Download
1 / 53
530 likes | 802 Views
LABOR MARKET IN THE LONG RUN. Long Run -- A period of time over which firms can enter and leave the market and existing firms can change all of their inputs including their production facilities;

E N D
LABOR MARKET IN THE LONG RUN Long Run -- A period of time over which firms can enter and leave the market and existing firms can change all of their inputs including their production facilities; • Supply side -- the period of time over which people can change occupations and/or migrate from one city to another.
LABOR MARKET The market for a specific occupation in a specific geographical area.
THREE RESPONSES TO AN INCREASE IN WAGE($10 to $12 per hour) • Less labor more leisure -- If Lester works 30 hours instead of 36, he gets 6 hours of extra leisure, but still earns the same income per week. • Same amount of labor and more income -- If Sam continues to work 36 hours per week, he gets an additional $72 of income and the same amount of leisure time. • More labor, less leisure time, and much more income -- If Maureen works 43 hours instead of 36, she sacrifices 7 hours of leisure time and earns a total of $516.
THE MARKET SUPPLY CURVE FOR LABOR • Shows the relationship between the wage and the quantity of labor supplied for a particular occupation; • The market supply is positively sloped, consistent with the law of supply: • The higher the wage (price of labor) the larger the quantity supplied
THE MARKET SUPPLY CURVE FOR LABOR An increase in the wage affects the quantity of nursing supplied in three ways: 1. Change in hours per worker. Some nurses will work more hours, others will work fewer hours, and others will work the same number of hours; 2. Occupational Choice. An increase in nursing wage will cause some workers to switch from other occupations to nursing and more new workers to choose nursing. 3. Migration. Some nurses in other cities will move to earn higher wages.
SUPPLY, DEMAND AND MARKET EQUILIBRIUM Wages $ Per Hour Market Supply Curve e 15 b 10 8,000 16,000 Hours of nursing per day
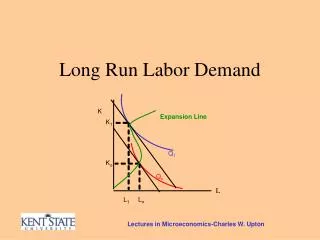
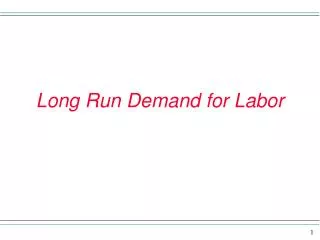
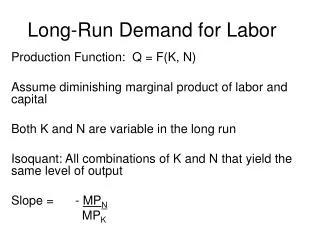
THE LONG-RUN DEMAND CURVE FOR LABOR • Is derived demand, since firms use labor and other inputs to produce goods and services: derived from the demand for the final product; • The long-run demand curve for labor is negatively sloped, consistent with the law of demand: • The higher the wage, the smaller the quantity of labor demanded.
THE LONG-RUN DEMAND CURVE FOR LABOR An increase in the wage will decrease the quantity of labor demanded for two reasons: 1. The output effect. An increase in wage will decrease the quantity of output sold by firms that use nurses. An increase in the nursing wage will increase the cost of medical services, causing people to spend less time in hospitals, so hospitals won’t need as many nurses. 2. The input-substitution effect. Firms will substitute other inputs for labor.
OTHER INPUT-SUBSTITUTION EFFECT EXAMPLES • Mining. U. S. firms use huge earth-moving equipment to mine for minerals, while some firms in less-developed countries use thousands of workers, digging by hand; • Furniture. Firms in developed countries manufacture furniture with sophisticated machinery and equipment, while some firms in less-developed countries make furniture by hand; • Accounting. Accountants in developed countries use computers and sophisticated software programs, while some accountants in less-developed countries use calculators and ledger paper.
SUPPLY, DEMAND AND MARKET EQUILIBRIUM Wages $ Per Hour Market Demand Curve Market Supply Curve e 15 b c 10 8,000 16,000 24,000 Hours of nursing per day
MARKET EQUILIBRIUM A situation in which there is no pressure to change the price of a good or service; • The supply curve intersects the demand curve at point e, so the equilibrium wage is $15 and the equilibrium quantity is 16,000 hours of nursing per day; • At this wage, there is neither shortage or surplus of labor, so the market has reached and equilibrium.
CHANGE IN DEMAND Causes price and quantity to move in the same direction: • An increase in demand increases the price and quantity; • A decrease in demand decreases the price and quantity; • An increase in demand will shift the demand curve to the right.
THE MARKET EFFECTS OF AN INCREASE IN DEMAND FOR LABOR Wages $ Per Hour Market Supply Curve f 17 e 15 New Demand Curve Original Demand Curve 19,000 16,000 Hours of nursing per day
CHANGE IN DEMAND Causes price and quantity to move in the same direction; An increase in demand increases the equilibrium wage and the equilibrium quantity of nursing services. CHANGE IN SUPPLY An increase in supply decreases the price, but increases the quantity; A decrease in supply increases the price but decreases the quantity; An increase in supply will shift the supply curve to the right.
SUPPLY OF NANNIES WITH AND WITHOUT AU PAIR Wages $ per month Supply with au pair program 800 DEMAND 30 Hours per month
NANNIES VERSUS AU PAIRS How would elimination of the au pair program affect the wage of nannies ? • The equilibrium wage for child-care services would, in this example, increase from $800 per month to $840 per month; • The number of child-care service hours offered would decrease from 30 to 28.
SUPPLY OF NANNIES WITH AND WITHOUT AU PAIR Wages $ per month Supply without au pair program Supply with au pair program 840 800 DEMAND 28 30 Hours per month
LABOR MARKET IN SHORT RUN Use the marginal principal: • Increase the level of activity if its marginal benefit exceeds its marginal cost, but reduce the level if the marginal cost exceeds the marginal benefit. If possible, pick the level at which the marginal benefit equals the marginal cost.
LABOR MARKET IN SHORT RUN $10 • A firm will pick the quantity of labor at which the marginal benefit of labor equals its marginal cost; Marginal Cost • If the firm is a price taker, it can hire as many workers as it wants at the market wage; • The firm’s marginal cost of labor is its hourly wage. $10 $10 $10 $10 $10 $10 $10 $10 $10
LABOR MARKET IN SHORT RUN Marginal Benefit The marginal benefit of labor equals the monetary value of the output produced with an additional hour of labor; Marginal Product of Labor -- The change in output per unit change in labor; Marginal Revenue of Product -- The price of the firm’s output times the marginal product of labor; The marginal benefit of labor is the firm’s marginal revenue of product (MRP). marginal benefit = marginal revenue of product (MRP) = price * marginal product
MARGINAL REVENUE OF PRODUCT CURVE $ per hour Marginal revenue product or demand curve Hours of labor per day
MARGINAL REVENUE OF PRODUCT CURVE The marginal revenue of product curve is negatively sloped because of the principal of diminishing returns; Principal of Diminishing Returns Suppose that output is produced with two or more inputs and that we increase one input while holding the other inputs fixed. Beyond some point -- called the point of diminishing returns -- output will increase at a decreasing rate.
MARGINAL REVENUE OF PRODUCT • As the firm adds more workers to an existing production facility, each worker uses a smaller piece of the firm’s production facility, so total output increases at a decreasing rate; • As quantity of labor increases, the marginal product of labor decreases; • If the marginal product of labor decreases and the price of labor is fixed, MRP decreases too.
MARGINAL REVENUE OF PRODUCT CURVE $ per hour At $15 per hour, the firm could not hire more than 20 hours, because the additional revenue from a 21st hour would be less than the additional cost ($15). Marginal revenue product or demand curve m Marginal cost when wage = $15 15 20 Hours of labor per day
MARGINAL REVENUE OF PRODUCT CURVE If the wage drops to $10, the firm will satisfy the marginal principal at n, hiring 30 hours of labor instead of 20. $ per hour Marginal revenue product or demand curve m Marginal cost when wage = $15 15 n Marginal cost when wage = $10 10 20 30 Hours of labor per day
SHORT-RUN LABOR DEMAND CURVE The MRP curve is the firm’s short-run demand curve for labor; • It shows the relationship between the wage and quantity of labor demanded in the short run.
WHAT CHANGES WOULD CAUSE THE DEMAND CURVE TO SHIFT ? Change in anything held fixed in drawing the curve will shift the entire curve; • An increase in the price of the final good will increase the MRP of workers, shifting the entire demand curve to the right; • If workers become more productive, the increase in the marginal product of labor will increase the MRP and shift the demand curve to the right; • A decrease in price or labor productivity would shift the demand curve to the left.
MARKET DEMAND AND EQUILIBRIUM The market demand curve for labor is the sum of the labor demands of all firms that use a particular type of labor; If all firms are identical, multiply the number of firms by the quantity of labor demanded by the typical firm
SHORT-RUN SUPPLY CURVE The supply curve is relatively steep because in the short run, workers cannot change occupations or migrate from one location to another; The only response to a change in the wage is that existing workers change the number of hours they work: When the wage increases, some workers work more, others work less, and others work about the same number of hours; The net effect of these changes in work hours varies from one occupation to another.
Market Equilibrium in the Short Run $ per Hour Short-run supply m 15 n 10 Short-run Market demand 2,000 3,000 Hours of labor per day
WHY DO WAGES DIFFER ACROSS OCCUPATIONS ? Wage for a particular occupation will be high if the supply of workers in that occupation is small relative to the demand for workers.
WHY WOULD SUPPLY OF WORKERS IN A PARTICULAR OCCUPATION BE SMALL ? 1. Few people with the required skills: examples include professional athletes, musicians and actors; 2. High training costs: examples include medical doctors and lawyers; 3. Undesirable job features: examples include jobs with greatest risk of dying, jobs that are stressful, dirty, or force people to work odd hours; 4. Artificial barriers to entry: examples include jobs that requires government or professional licensing, or union membership.
Supply is Low Relative to Demand Wages $ per Hour Market Supply Curve f 20 Market Demand Curve 8,000 16,000 Hours of nursing per day
WHY DO WOMEN, ON AVERAGE, EARN LESS THAN MEN ? • Women in many occupations have less education and less work experience, so they are less productive and paid less; • Occupational discrimination: - Women have been denied access to many occupations, causing them to flood a small number of “female- dominated” occupations; - Given a plentiful supply in these occupations, wages are relatively low.
WHAT ABOUT DIFFERENCES IN EARNINGS BY RACE ? Of full-time workers in 1995 • Black males earned 73% as much as white males; • Black females earned 86% as much as white females; • Hispanic males earned 62% as much as white males; • Hispanic females earned 73% as much as white females;
WHAT ABOUT DIFFERENCES IN EARNINGS BY RACE ? • For both males and females, part of the earnings gap is caused by differences in productivity: -- On average, whites have more education and work experience, so they receive higher wages; • Part of the wage gap is caused by racial discrimination: -- Some black and Hispanic workers receive lower wages for similar jobs; -- Others are denied opportunities to work in some high-paying jobs.
WHY DO COLLEGE GRADUATES EARN HIGHER WAGES ? In 1982 the typical college graduate earned 82% more than the typical high-school graduate. • The learning effect of a college education: Students learn the skills required for certain occupations; • The signaling effect or screening effect of college: Completion of college provides a signal to employers about the skills of a potential worker; Colleges indirectly screen job applicants, separating admissible from the inadmissible.
PUBLIC POLICY AND LABOR MARKETS • Minimum Wage; • Comparable Worth; • Occupational Licensing
MARKET EFFECTS OF THE MINIMUM WAGE Wages $ per hour Supply d 4.40 e 4.00 Demand 49 50 Hours of restaurant labor per day (1,000)
EFFECTS OF THE MINIMUM WAGE • Good news for workers -- Some workers keep their jobs and receive a higher wage ($4.40 an hour instead of $4.00); • Bad news for workers -- Some workers lose their jobs; If the typical workday for a restaurant worker were 5 hours, the loss of 1,000 hours of restaurant work per day translates into a loss of 200 jobs; • Bad news for consumers -- The increase in the wage increase the cost of producing restaurant meals, increasing the price.
COMPARABLE WORTH The government specifies a minimum wage for some occupations, typically occupations with a disproportionate number of women; • Some women in female-dominated occupations would earn higher wages; • Others would lose their jobs; • Consumers would pay higher prices.
OCCUPATIONAL LICENSING In some occupations, the number of workers is limited by government-sanctioned licensing boards; For example a person may be prohibited from working in an occupation unless he: 1. completes a given educational program; 2. passes an examination; 3. has a certain amount of work experience, and/or 4. has lived in a particular area for some time; Among workers subject to occupational licensing are physicians, dentists, beauticians, plumbers, and pharmacists.
OCCUPATIONAL LICENSING In principle, the licensing requirements are to protect consumers from incompetent workers; however, occupational licensing is criticized on three grounds: 1. Weak link between performance and licensing requirements. In many cases, licensing requirements seem arbitrary; 2. Alternative means of protection. The government could provide consumers with information about past performance of workers, or consumers could spread word of worker performance; 3. Easy restrictions. The licensing requirements increase the cost of entering the occupation, decreasing the supply of workers and increasing the wage.
MARKET EFFECTS OF OCCUPATIONAL LICENSING Wages $ per hour New Supply: 6 years of education Initial Supply: 5 years of education g 17 e 15 Demand 24 32 Hours of Pharmacist labor per day (1,000)
LABOR UNIONS An organized group of workers, the main objective of which is to improve working conditions, wages, and fringe benefits; Workers in a union do not take wages as a given, but try to increase them.
UNION MEMBER SHIP IN DIFFERENT COUNTRIES IN 1990 % of workers in Unions 100 90 80 70 60 50 40 30 20 10 0 United States Canada Britain Denmark Japan Germany Italy Sweden
LABOR UNIONS Today, one-fifth of all workers in the United States belong to a union, down from one-third forty years ago. Two Types of Unions: • A craft union includes workers from a particular occupation, for example, plumbers, bakers, or electricians; • An industrial union includes all types of workers from a single industry, for example, steel workers or auto workers. There are also umbrella organizations that include many individual unions. The largest of these is the AFL CIO (the American Federation of Labor Congress of Industrial Organizations).
THREE WAYS A UNION TRIES TO INCREASE WAGES OF ITS MEMBERS 1. Organize and negotiate a higher wage; • Generates a tradeoff between wages and total employment; 2. Promote products produced by union workers; • By increasing demand for a final good, demand is increased for labor (derived demand), increasing equilibrium wage; 3. Impose work rules that increase the amount of labor required to produce a given quantity of output;
IMPERFECT INFORMATION AND EFFICIENCY WAGES Asymmetric Information • Employers cannot always distinguish between skillful and unskillful workers and between hard workers and lazy ones. • Suppose two types of workers: • low skill (marginal revenue of product = $100 per day) • high skill (marginal revenue of product = $200 per day) • What is an appropriate single wage ? - Suppose the opportunity cost of high-skill workers is $130 and a firm offers a wage of $110; - Only low skill workers will apply for jobs; - The firm will lose money because the wage ($110) exceeds the marginal revenue of product of low-skill workers ($100).
IMPERFECT INFORMATION AND EFFICIENCY WAGES • To get some high-skill workers, the employer must pick a wage that exceed the opportunity cost ($130); • As firm increases its wages: - It attracts more high-skill workers; - the average productivity of its workforce will increase; - depending on responses of two types of workers to higher wage, a firm could actually make more profit by offering a higher wage; Paying efficiency wages The firm pays higher wages to increase the average productivity of its workforce.