Download

1 / 16
170 likes | 413 Views
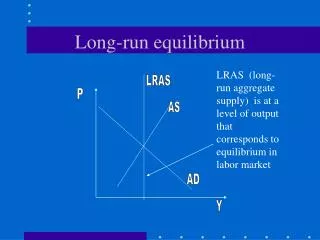
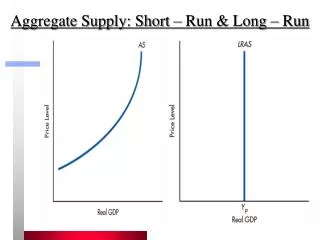
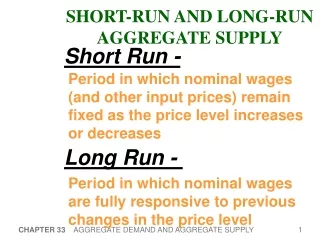
Short-Run vs. Long-Run. Short-Run No time for economy to make adjustments Nominal wages remain fixed as price level changes. Long-Run Economy has sufficient time to make adjustments Nominal wages are responsive to price level changes. Graph of Extended AD-AS model. Why is LRAS vertical?.

E N D
Short-Run • No time for economy to make adjustments • Nominal wages remain fixed as price level changes • Long-Run • Economy has sufficient time to make adjustments • Nominal wages are responsive to price level changes
Why is LRAS vertical? • Demand-pull inflation increases AD, PL increases, output increases…. • If PL increases, workers real wages decrease, causes unrest • Workers receive increase in nominal wages to increase purchasing power… • Causes SRAS to shift left….. • Cycle repeats over time…..
Recessionary gaps vs. Inflationary Gaps • Inflationary gaps • The amount by which agg. Expenditures at full-employment GDP exceed those necessary to achieve full-employment GDP. • Inflation shifts AD right • Where would this be on a graph? • Recessionary Gaps • The amount by which agg. Expenditures at the full-employment GDP fall short of those required to achieve full employment GDP • Recessions shift AD left • Where would this be on a graph?
Macro instability – Cost-push inflation • If AD shifts right due to cost-push inflation, what happens to PL and unemployment? • Price level increases, but unemployment decreases • Generalization – there is an inverse relationship between inflation and unemployment • The dude that came up with this idea is A.W. Phillips…so we call this the Phillips curve
So what? • This explains a basic theory of macroeconomics….output creates jobs, but comes at a price….an increased price….hahaha • Get it? • Do ya? • Seriously, do you get it?
Stagflation • Refutes the Phillips curve generalization • Increasing PL and Unemployment rate • Due to shock (unexpected) to AS determinants such as increases in resource costs… • Example – OPEC during the 1970’s….
Supply-Side Economics Enough Said….
Supply-Side Economics • Proponents believe that changes in AS must be recognized as active forces in determining the levels of both inflation and unemployment. • As adverse conditions arise, the government can manipulate AS to reduce these problems.
Characteristics of Supply-Side policies • Lower taxes to increase incentive to work • Reductions in marginal tax rates increase the nation’s aggregate supply. • And, this reduction could possibly lead to increased tax revenue (Arthur Laffer) • Exhibited by Laffer curve
Characteristics Continued…. • Reduce public transfer programs that diminish the crisis of being unemployed. • Reduce government regulation • Increase incentives to save and invest • Mostly done by lowering marginal tax rates