Download
1 / 1
10 likes | 131 Views
STUDY OF POP ATMOSPHERIC MOBILITY BY QSAR APPROACH. Paola Gramatica , Stefano Pozzi, Federica Consolaro and Roberto Todeschini § QSAR Research Unit, Dep. of Structural and Functional Biology, University of Insubria, via Dunant 3, 21100 Varese (Italy)

E N D
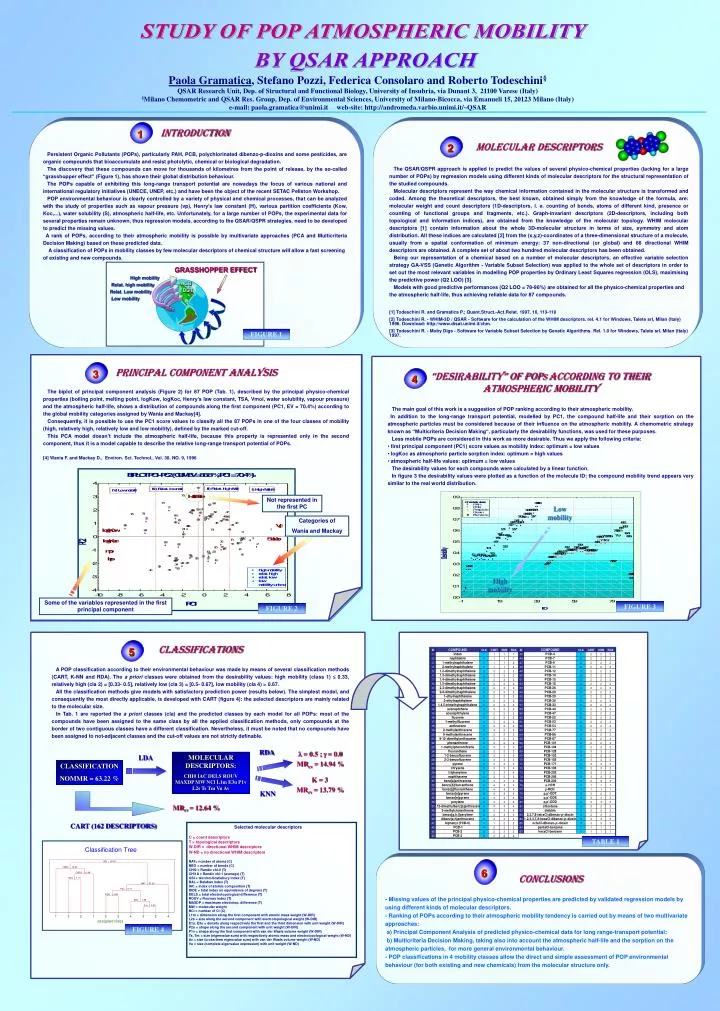
STUDY OF POP ATMOSPHERIC MOBILITY BY QSAR APPROACH Paola Gramatica, Stefano Pozzi, Federica Consolaro and Roberto Todeschini§ QSAR Research Unit, Dep. of Structural and Functional Biology, University of Insubria, via Dunant 3, 21100 Varese (Italy) §Milano Chemometric and QSAR Res. Group, Dep. of Environmental Sciences, University of Milano-Bicocca, via Emanueli 15, 20123 Milano (Italy) e-mail: paola.gramatica@unimi.it web-site: http://andromeda.varbio.unimi.it/~QSAR • MOLECULAR DESCRIPTORS • The QSAR/QSPR approach is applied to predict the values of several physico-chemical properties (lacking for a large number of POPs) by regression models using different kinds of molecular descriptors for the structural representation of the studied compounds. • Molecular descriptors represent the way chemical information contained in the molecular structure is transformed and coded. Among the theoretical descriptors, the best known, obtained simply from the knowledge of the formula, are: molecular weight and count descriptors (1D-descriptors, i. e. counting of bonds, atoms of different kind, presence or counting of functional groups and fragments, etc.). Graph-invariant descriptors (2D-descriptors, including both topological and information indices), are obtained from the knowledge of the molecular topology. WHIM molecular descriptors [1] contain information about the whole 3D-molecular structure in terms of size, symmetry and atom distribution. All these indices are calculated [2] from the (x,y,z)-coordinates of a three-dimensional structure of a molecule, usually from a spatial conformation of minimum energy: 37 non-directional (or global) and 66 directional WHIM descriptors are obtained. A complete set of about two hundred molecular descriptors has been obtained. • Being our representation of a chemical based on a number of molecular descriptors, an effective variable selection strategy GA-VSS (Genetic Algorithm - Variable Subset Selection) was applied to the whole set of descriptors in order to set out the most relevant variables in modelling POP properties by Ordinary Least Squares regression (OLS), maximising the predictive power (Q2 LOO) [3]. • Models with good predictive performances (Q2 LOO = 78-96%) are obtained for all the physico-chemical properties and the atmospheric half-life, thus achieving reliable data for 87 compounds. • [1] Todeschini R. and Gramatica P.; Quant.Struct.-Act.Relat. 1997, 16, 113-119 • [2] Todeschini R. - WHIM-3D / QSAR - Software for the calculation of the WHIM descriptors. rel. 4.1 for Windows, Talete srl, Milan (Italy) 1996. Download: http://www.disat.unimi.it/chm. • [3] Todeschini R. - Moby Digs - Software for Variable Subset Selection by Genetic Algorithms. Rel. 1.0 for Windows, Talete srl, Milan (Italy) 1997. INTRODUCTION Persistent Organic Pollutants (POPs), particularly PAH, PCB, polychlorinated dibenzo-p-dioxins and some pesticides, are organic compounds that bioaccumulate and resist photolytic, chemical or biological degradation. The discovery that these compounds can move for thousands of kilometres from the point of release, by the so-called “grasshopper effect” (Figure 1), has shown their global distribution behaviour. The POPs capable of exhibiting this long-range transport potential are nowadays the focus of various national and international regulatory initiatives (UNECE, UNEP, etc.) and have been the object of the recent SETAC Pellston Workshop. POP environmental behaviour is clearly controlled by a variety of physical and chemical processes, that can be analyzed with the study of properties such as vapour pressure (vp), Henry’s law constant (H), various partition coefficients (Kow, Koc,...), water solubility (S), atmospheric half-life, etc. Unfortunately, for a large number of POPs, the experimental data for several properties remain unknown, thus regression models, according to the QSAR/QSPR strategies, need to be developed to predict the missing values. A rank of POPs, according to their atmospheric mobility is possible by multivariate approaches (PCA and Multicriteria Decision Making)based on these predicted data. A classification of POPs in mobility classes by few molecular descriptors of chemical structure will allow a fast screening of existing and new compounds. 1 2 GRASSHOPPER EFFECT High mobility HCB Relat. high mobility DDT Relat. Low mobility Low mobility FIGURE 1 • “DESIRABILITY” OF POPs ACCORDING TO THEIR • ATMOSPHERIC MOBILITY • The main goal of this work is a suggestion of POP ranking according to their atmospheric mobility. • In addition to the long-range transport potential, modelled by PC1, the compound half-life and their sorption on the atmospheric particles must be considered because of their influence on the atmospheric mobility. A chemometric strategy known as “Multicriteria Decision Making“, particularly the desirability functions, was used for these purposes. • Less mobile POPs are considered in this work as more desirable. Thus we apply the following criteria: • first principal component (PC1) score values as mobility index: optimum = low values • logKoc as atmospheric particle sorption index: optimum = high values • atmospheric half-life values: optimum = low values • The desirability values for each compounds were calculated by a linear function. • In figure 3 the desirability values were plotted as a function of the molecule ID; the compound mobility trend appears very similar to the real world distribution. 3 PRINCIPAL COMPONENT ANALYSIS Thebiplot of principal component analysis (Figure 2) for 87 POP (Tab. 1), described by the principal physico-chemical properties (boiling point, melting point, logKow, logKoc, Henry’s law constant, TSA, Vmol, water solubility, vapour pressure) and the atmospheric half-life, shows a distribution of compounds along the first component (PC1, EV = 70.4%) according to the global mobility categories assigned by Wania and Mackay[4]. Consequently, it is possible to use the PC1 score values to classify all the 87 POPs in one of the four classes of mobility (high, relatively high, relatively low and low mobility), defined by the marked cut-off. This PCA model doesn’t include the atmospheric half-life, because this property is represented only in the second component, thus it is a model capable to describe the relative long-range transport potential of POPs. [4] Wania F. and Mackay D., Environ. Sci. Technol., Vol. 30, NO. 9, 1996 4 Not represented in the first PC Low mobility Categories of Wania and Mackay High mobility Some of the variables represented in the first principal component FIGURE 3 FIGURE 2 CLASSIFICATIONS A POP classification according to their environmental behaviour was made by means of several classification methods (CART, K-NN and RDA). The a priori classes were obtained from the desirability values: high mobility (class 1) 0.33, relatively high (cla 2) = [0.33- 0.5], relatively low (cla 3) = [0.5- 0.67], low mobility (cla 4) > 0.67. All the classification methods give models with satisfactory prediction power (results below). The simplest model, and consequently the most directly applicable, is developed with CART (figure 4): the selected descriptors are mainly related to the molecular size. In Tab. 1 are reported the a priori classes (cla) and the predicted classes by each model for all POPs: most of the compounds have been assigned to the same class by all the applied classification methods, only compounds at the border of two contiguous classes have a different classification. Nevertheless, it must be noted that no compounds have been assigned to not-adjacent classes and the cut-off values are not strictly definable. 5 RDA = 0.5 ; = 0.0 MRcv = 14.94 % LDA MOLECULAR DESCRIPTORS: CHI0 IAC DELS ROUV MAXDP MW NCl L1m E3u P1v L2s Ts Tm Vu Av CLASSIFICATION NOMMR = 63.22 % K = 3 MRcv = 13.79 % KNN MRcv = 12.64 % CART (162 DESCRIPTORS) Selected molecular descriptors C = count descriptors T = topological descriptors W-DIR = directional WHIM descriptors W-ND = no directional WHIM descriptors NAT= number of atoms (C) NBO = number of bonds (C) CHI0 = Randic chi-0 (T) CHI1A = Randic chi-1 (average) (T) GSI = Gordon-Scatlebury index (T) BAL = Balaban index (T) IAC = index of atomic composition (T) IDDE = total index on equivalence of degrees (T) DELS = total electrotopological difference (T) ROUV= Rouvray index (T) MAXDP= maximum electrotop. difference (T) MW= molecular weight NCl= number of Cl (C) L1m= dimension along the first component with atomic mass weight (W-DIR) L2s = size along the second component with electrotopological weight (W-DIR) E1u, E3u = density along respectively the first and the third dimension with unit weight (W-DIR) P2u = shape along the second component with unit weight (W-DIR) P1v = shape along the first component with van der Waals volume weight (W-DIR) Ts, Tm= size (eigenvalue sum) with respectively atomic mass and electrotopological weight (W-ND) Av = size (cross-term eigenvalue sum) with van der Waals volume weight (W-ND) Vu = size (complete eigenvalue expression) with unit weight (W-ND) TABLE 1 CONCLUSIONS -Missing values of the principal physico-chemical properties are predicted by validated regression models by using different kinds of molecular descriptors. - Ranking of POPs according to their atmospheric mobility tendency is carried out by means of two multivariate approaches: a) Principal Component Analysis of predicted physico-chemical data for long range-transport potential; b) Multicriteria Decision Making, taking also into account the atmospheric half-life and the sorption on the atmospheric particles, for more general environmental behaviour. - POP classifications in 4 mobility classes allow the direct and simple assessment of POP environmental behaviour (for both existing and new chemicals) from the molecular structure only. 6 FIGURE 4