Download
1 / 1
10 likes | 78 Views
The Cosmic Evolution Survey (COSMOS): galaxy morphologies and colors as a function of mass and environment at z=0.7

E N D
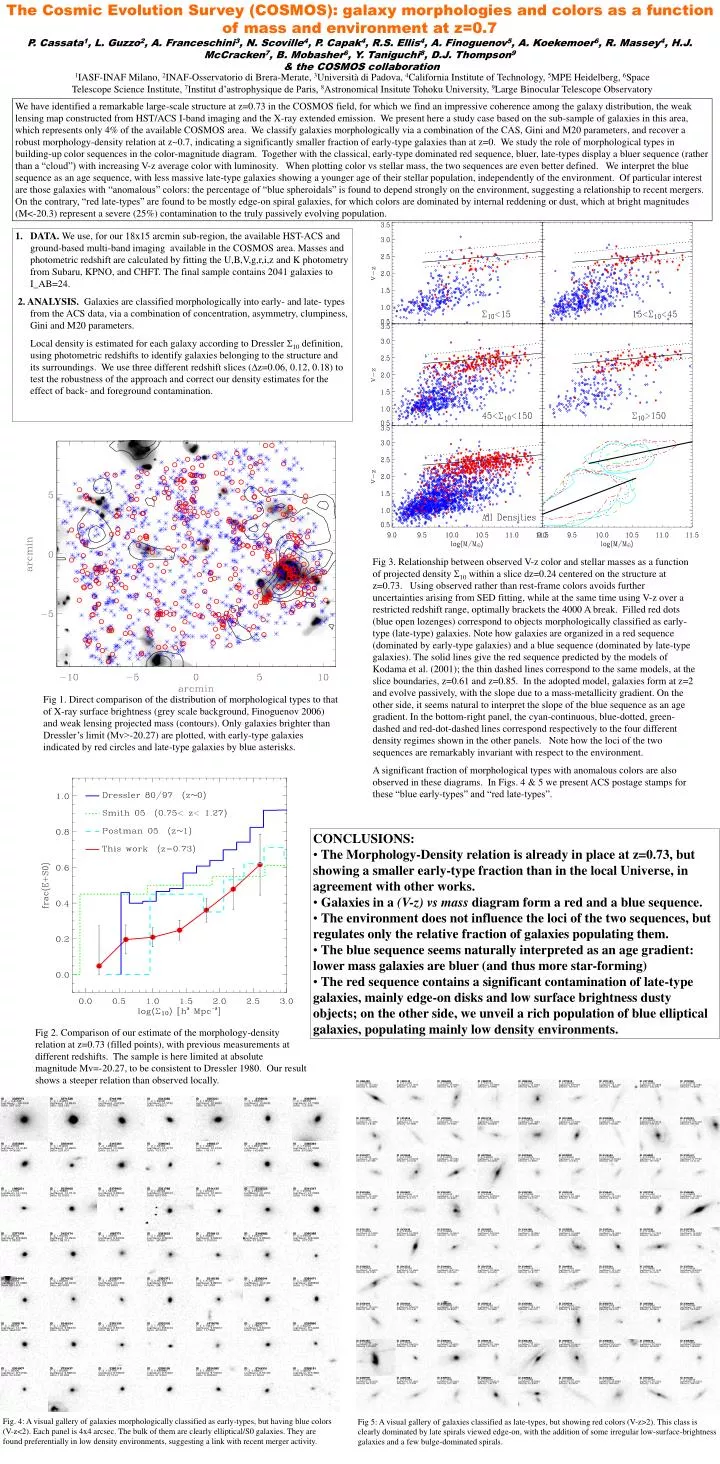
The Cosmic Evolution Survey (COSMOS): galaxy morphologies and colors as a function of mass and environment at z=0.7 P. Cassata1, L. Guzzo2, A. Franceschini3, N. Scoville4, P. Capak4, R.S. Ellis4, A. Finoguenov5, A. Koekemoer6, R. Massey4, H.J. McCracken7, B. Mobasher6, Y. Taniguchi8, D.J. Thompson9 & the COSMOS collaboration Fig 3. Relationship between observed V-z color and stellar masses as a function of projected density 10 within a slice dz=0.24 centered on the structure at z=0.73. Using observed rather than rest-frame colors avoids further uncertainties arising from SED fitting, while at the same time using V-z over a restricted redshift range, optimally brackets the 4000 A break. Filled red dots (blue open lozenges) correspond to objects morphologically classified as early-type (late-type) galaxies. Note how galaxies are organized in a red sequence (dominated by early-type galaxies) and a blue sequence (dominated by late-type galaxies). The solid lines give the red sequence predicted by the models of Kodama et al. (2001); the thin dashed lines correspond to the same models, at the slice boundaries, z=0.61 and z=0.85. In the adopted model, galaxies form at z=2 and evolve passively, with the slope due to a mass-metallicity gradient. On the other side, it seems natural to interpret the slope of the blue sequence as an age gradient. In the bottom-right panel, the cyan-continuous, blue-dotted, green-dashed and red-dot-dashed lines correspond respectively to the four different density regimes shown in the other panels. Note how the loci of the two sequences are remarkably invariant with respect to the environment. A significant fraction of morphological types with anomalous colors are also observed in these diagrams. In Figs. 4 & 5 we present ACS postage stamps for these “blue early-types” and “red late-types”. Fig 1. Direct comparison of the distribution of morphological types to that of X-ray surface brightness (grey scale background, Finoguenov 2006) and weak lensing projected mass (contours). Only galaxies brighter than Dressler’s limit (Mv>-20.27) are plotted, with early-type galaxies indicated by red circles and late-type galaxies by blue asterisks. Fig 2. Comparison of our estimate of the morphology-density relation at z=0.73 (filled points), with previous measurements at different redshifts. The sample is here limited at absolute magnitude Mv=-20.27, to be consistent to Dressler 1980. Our result shows a steeper relation than observed locally. Fig 5: A visual gallery of galaxies classified as late-types, but showing red colors (V-z>2). This class is clearly dominated by late spirals viewed edge-on, with the addition of some irregular low-surface-brightness galaxies and a few bulge-dominated spirals. Fig. 4: A visual gallery of galaxies morphologically classified as early-types, but having blue colors (V-z<2). Each panel is 4x4 arcsec. The bulk of them are clearly elliptical/S0 galaxies. They are found preferentially in low density environments, suggesting a link with recent merger activity. 1IASF-INAF Milano, 2INAF-Osservatorio di Brera-Merate, 3Università di Padova, 4California Institute of Technology, 5MPE Heidelberg, 6Space Telescope Science Institute, 7Institut d’astrophysique de Paris, 8Astronomical Insitute Tohoku University, 9Large Binocular Telescope Observatory We have identified a remarkable large-scale structure at z=0.73 in the COSMOS field, for which we find an impressive coherence among the galaxy distribution, the weak lensing map constructed from HST/ACS I-band imaging and the X-ray extended emission. We present here a study case based on the sub-sample of galaxies in this area, which represents only 4% of the available COSMOS area. We classify galaxies morphologically via a combination of the CAS, Gini and M20 parameters, and recover a robust morphology-density relation at z~0.7, indicating a significantly smaller fraction of early-type galaxies than at z=0. We study the role of morphological types in building-up color sequences in the color-magnitude diagram. Together with the classical, early-type dominated red sequence, bluer, late-types display a bluer sequence (rather than a “cloud”) with increasing V-z average color with luminosity. When plotting color vs stellar mass, the two sequences are even better defined. We interpret the blue sequence as an age sequence, with less massive late-type galaxies showing a younger age of their stellar population, independently of the environment. Of particular interest are those galaxies with “anomalous” colors: the percentage of “blue spheroidals” is found to depend strongly on the environment, suggesting a relationship to recent mergers. On the contrary, “red late-types” are found to be mostly edge-on spiral galaxies, for which colors are dominated by internal reddening or dust, which at bright magnitudes (M<-20.3) represent a severe (25%) contamination to the truly passively evolving population. • DATA. We use, for our 18x15 arcmin sub-region, the available HST-ACS and ground-based multi-band imaging available in the COSMOS area. Masses and photometric redshift are calculated by fitting the U,B,V,g,r,i,z and K photometry from Subaru, KPNO, and CHFT. The final sample contains 2041 galaxies to I_AB=24. • 2. ANALYSIS. Galaxies are classified morphologically into early- and late- types from the ACS data, via a combination of concentration, asymmetry, clumpiness, Gini and M20 parameters. • Local density is estimated for each galaxy according to Dressler 10 definition, using photometric redshifts to identify galaxies belonging to the structure and its surroundings. We use three different redshift slices (z=0.06, 0.12, 0.18) to test the robustness of the approach and correct our density estimates for the effect of back- and foreground contamination. • CONCLUSIONS: • The Morphology-Density relation is already in place at z=0.73, but showing a smaller early-type fraction than in the local Universe, in agreement with other works. • Galaxies in a (V-z) vs mass diagram form a red and a blue sequence. • The environment does not influence the loci of the two sequences, but regulates only the relative fraction of galaxies populating them. • The blue sequence seems naturally interpreted as an age gradient: lower mass galaxies are bluer (and thus more star-forming) • The red sequence contains a significant contamination of late-type galaxies, mainly edge-on disks and low surface brightness dusty objects; on the other side, we unveil a rich population of blue elliptical galaxies, populating mainly low density environments.