Download
1 / 17
250 likes | 419 Views
Development of the Healthy Eating Index-2005. Patricia M. Guenther, PhD, RD: US Department of Agriculture, Center for Nutrition Policy and Promotion Jill Reedy, PhD, RD: National Cancer Institute (NCI) Susan M. Krebs-Smith, PhD, RD: NCI. JOURNAL OF THE AMERICAN DIETETIC ASSOCIATION.

E N D
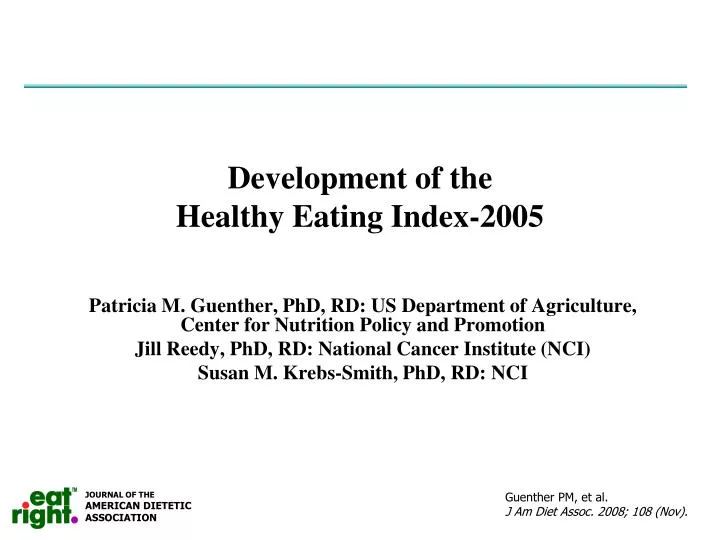
Development of the Healthy Eating Index-2005 Patricia M. Guenther, PhD, RD: US Department of Agriculture, Center for Nutrition Policy and Promotion Jill Reedy, PhD, RD: National Cancer Institute (NCI) Susan M. Krebs-Smith, PhD, RD: NCI JOURNAL OF THEAMERICAN DIETETICASSOCIATION Guenther PM, et al. J Am Diet Assoc. 2008; 108 (Nov).
Development of the Healthy Eating Index-2005 Purpose of this project • Revise Healthy Eating Index • to conform to 2005 Dietary • Guidelines for Americans JOURNAL OF THEAMERICAN DIETETICASSOCIATION Guenther PM, et al. J Am Diet Assoc. 2008; 108 (Nov).
Development of the Healthy Eating Index-2005 From science to assessment Healthy Eating Index-2005 JOURNAL OF THEAMERICAN DIETETICASSOCIATION Guenther PM, et al. J Am Diet Assoc. 2008; 108 (Nov).
Development of the Healthy Eating Index-2005 Original Healthy Eating Index • Released in 1995 • 10 components • 5 adequacy—major food groups • 4 moderation—sodium and 3 fat-related • Variety—number of different foods eaten, regardless of food group • Based on absolute intakes JOURNAL OF THEAMERICAN DIETETICASSOCIATION Guenther PM, et al. J Am Diet Assoc. 2008; 108 (Nov).
Development of the Healthy Eating Index-2005 Healthy Eating Index-2005 • Total Fruit (includes juice) • Whole Fruit (excludes juice) • Total Vegetables • Dark Green and Orange Vegetables and Legumes (when not counted as meat) • Total Grains • Whole Grains • Milk (all milk products, soy beverages) • Meat & Beans • Oils (includes oils in fish, nuts, seeds) • Saturated Fat • Sodium • Calories from Solid fats (includes milk fat), Alcoholic beverages and Added Sugars (SoFAAS) JOURNAL OF THEAMERICAN DIETETICASSOCIATION Guenther PM, et al. J Am Diet Assoc. 2008; 108 (Nov).
Development of the Healthy Eating Index-2005 Component maximum scores • Total Fruit (5) • Whole Fruit (5) • Total Vegetables • Dark Green and Orange Vegetables and Legumes (5) • Total Grains (5) • Whole Grains (5) • Milk (10) • Meat & Beans (10) • Oils (10) • Saturated Fat (10) • Sodium (10) • Calories from Solid Fats, Alcoholic beverages and Added Sugars (SoFAAS) (20) JOURNAL OF THEAMERICAN DIETETICASSOCIATION Guenther PM, et al. J Am Diet Assoc. 2008; 108 (Nov).
Development of the Healthy Eating Index-2005 Density approach • Density standards • Express recommended amounts per 1000 calories or percentage of energy • True to pattern intentions • Assesses the mix of foods • No need to determine an individual’s appropriate calorie level JOURNAL OF THEAMERICAN DIETETICASSOCIATION Guenther PM, et al. J Am Diet Assoc. 2008; 108 (Nov).
Development of the Healthy Eating Index-2005 Complementary measures • Biomarkers of long term energy balance • Body Mass Index • Waist circumference • Physical activity JOURNAL OF THEAMERICAN DIETETICASSOCIATION Guenther PM, et al. J Am Diet Assoc. 2008; 108 (Nov).
Development of the Healthy Eating Index-2005 Scoring standards • Adequacy components • Maximum scores based on MyPyramid recommendations • Minimum scores based on zero intake • Moderation components • Maximum scores based on scientific standards • Minimum scores based on population • 1-day distributions JOURNAL OF THEAMERICAN DIETETICASSOCIATION Guenther PM, et al. J Am Diet Assoc. 2008; 108 (Nov).
Development of the Healthy Eating Index-2005 Total Grains scoring standard Based on MyPyramid recommendations JOURNAL OF THEAMERICAN DIETETICASSOCIATION Guenther PM, et al. J Am Diet Assoc. 2008; 108 (Nov).
Development of the Healthy Eating Index-2005 10 points 8 points 0 points 15% 7% 10% Saturated Fat scoring standards Based on 1-day distribution 20% 3% Percent of energy from saturated fat JOURNAL OF THEAMERICAN DIETETICASSOCIATION Guenther PM, et al. J Am Diet Assoc. 2008; 108 (Nov).
Development of the Healthy Eating Index-2005 Discretionary calories • Introduced by 2005 Dietary Guidelines Advisory Committee • “Difference between total energy requirements and energy consumed to meet recommended nutrient intakes” • Always includes solid fats, alcoholic beverages and added sugars • Includes MyPyramid food groups above recommended amounts (e.g., grains and meat) JOURNAL OF THEAMERICAN DIETETICASSOCIATION Guenther PM, et al. J Am Diet Assoc. 2008; 108 (Nov).
Development of the Healthy Eating Index-2005 Proxy measure for discretionary calories • Calories from Solid Fats, Alcoholic beverages and Added Sugars • Represents a subset of all discretionary calories • Does not cover intakes above recommended amounts of MyPyramid food groups • Standards based on discretionary calorie allowances and population 1-day distributions JOURNAL OF THEAMERICAN DIETETICASSOCIATION Guenther PM, et al. J Am Diet Assoc. 2008; 108 (Nov).
Development of the Healthy Eating Index-2005 Calories from Solid Fats, Alcohol and Added Sugars Maximum score based on discretionary calorie allowances JOURNAL OF THEAMERICAN DIETETICASSOCIATION Guenther PM, et al. J Am Diet Assoc. 2008; 108 (Nov).
Development of the Healthy Eating Index-2005 50% 20% 0 points 20 points Calories from Solid Fats, Alcohol and Added Sugars Minimum score based on 1-day distribution 10% 70% 20% 50% Percent of energy from Solid Fat, Alcohol and Added Sugars JOURNAL OF THEAMERICAN DIETETICASSOCIATION Guenther PM, et al. J Am Diet Assoc. 2008; 108 (Nov).
Development of the Healthy Eating Index-2005 Conclusion • The Healthy Eating Index-2005 is a tool for assessing diet quality according to 2005 Dietary Guidelines for Americans • Potential applications • Monitor diet quality of populations • Use as a research tool • Evaluate nutrition interventions JOURNAL OF THEAMERICAN DIETETICASSOCIATION Guenther PM, et al. J Am Diet Assoc. 2008; 108 (Nov).
Development of the Healthy Eating Index-2005 From science to assessment Healthy Eating Index-2005 www.cnpp.usda.gov/HealthyEatingIndex JOURNAL OF THEAMERICAN DIETETICASSOCIATION Guenther PM, et al. J Am Diet Assoc. 2008; 108 (Nov).