Download
1 / 16
280 likes | 583 Views
The Demographic Transition Model (DTM). We are learning to…. Describe how the population changes at each stage of the DTM Explain why birth and death rates change at each stage Give example of countries that fit into each stage. I Can…. Interpret each stage of the DTM

E N D
We are learning to… • Describe how the population changes at each stage of the DTM • Explain why birth and death rates change at each stage • Give example of countries that fit into each stage
I Can… • Interpret each stage of the DTM • Give an account of the reasons behind the changes in birth and death rates at each stage • Name countries that fit each stage
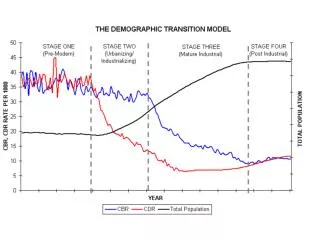
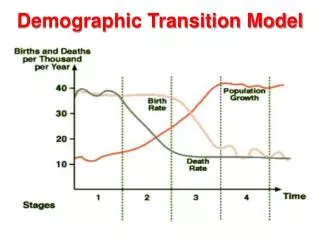
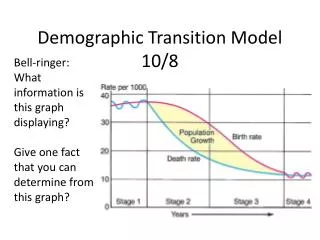
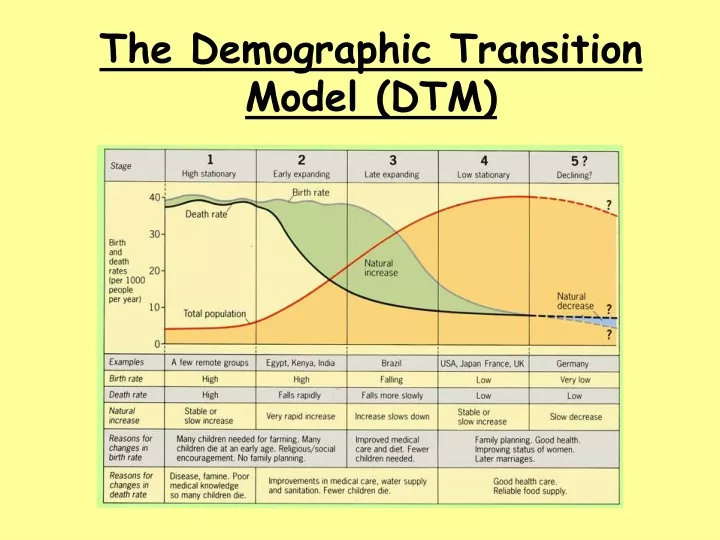
The DTM shows the changes in birth rates and death rates of a typical country over time. The DTM has four main stages, and countries move from one stage to the next over time. The least developed countries might still be in Stages 1 and 2, while the most developed countries are in Stage 4. there is now though to be a stage 5 too. DTM
Stage 1 – A high stationary population • Both birth rates and death rates are very high • Total population is very low • Natural increase is low There are very few countries in stage 1 today – possibly only remote groups in the rainforest The UK was in Stage 1 before 1760
Stage 2 – An early expanding population • Birth rates are still high • Death rates are falling • Total population is increasing • Natural increase is high Some of the poorest developing countries are still in Sage 2 e.g. Malawi and Bangladesh The UK was in Stage 2 between 1760 and 1900
Stage 3 – A late expanding population • Birth rates are falling • Death rates are also continuing to fall • Total population is increasing • Natural increase is quite high Most developing countries are in Stage 3, such as Brazil. The UK was in Stage 3 between 1900 and 1950
Stage 4 – A low stationary population • Birth rates and death rates are low • Total population is steady • Natural increase is very low Most developed countries are in Stage 4, such as the UK and USA. The UK has been in Stage 4 since the 1950s
Stage 5 – A declining population • Death rates remain low • Birth rates are low and decreasing • Total population is decreasing • Natural increase is negative Some developed countries are now in Stage 5, such as Australia and Germany
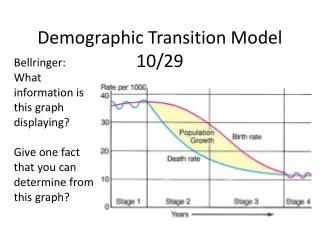
Task One • Explain why a country’s population a) grows slowly during Stage 1; b) grows quickly during Stage 2. • Which stage of the DTM has: a) high BR and decreasing DR; b) BRs lower than DRs; c) low DRs and decreasing BRs; d) both BRs and DRs very high; e) low BRs and DRs • Why are BRs high in Stage 1? • Give reasons for death rates falling in Stage 2 • What does the Demographic Transition Model show? • Look at the graph in your booklet: a) Describe the changes in birth rates in a typical country over time. b) Describe the changes in death rates in a typical country over time. c) Describe the changes in population in a typical country over time.
Task Two Working in groups: Read through the information for the five countries below and decide into which stage of the DTM each country fits Country 1 GDP per capita $619 BR: 35/1000 DR: 15/1000 Country 2 GDP per capita $45903 BR: 7/1000 DR: 9/1000 Country 3 GDP per capita $443 BR: 40/1000 DR: 35/1000 Country 4 GDP per capita $2781 BR: 22/1000 DR: 10/1000 Country 5 GDP per capita $28423 BR: 13/1000 DR: 8/1000
Task Two Below is what you should have come up with: S = Stage Country 1 GDP per capita $619 BR: 35/1000 DR: 15/1000 Country 2 GDP per capita $45903 BR: 7/1000 DR: 9/1000 Country 3 GDP per capita $443 BR: 40/1000 DR: 35/1000 S - 2 S - 5 S - 1 Country 4 GDP per capita $2781 BR: 22/1000 DR: 10/1000 Country 5 GDP per capita $28423 BR: 13/1000 DR: 8/1000 S - 3 S - 4
Task Three On A3 paper, produce a poster showing the DTM along with the corresponding population pyramids
We were learning to… • Describe how the population changes at each stage of the DTM • Explain why birth and death rates change at each stage • Give example of countries that fit into each stage
Can I… • Account for the changes at each stage of the DTM • Place countries in the appropriate stage of the DTM according to their GDP, BR and DR