Download
1 / 17
180 likes | 431 Views
Bellringer : What information is this graph displaying? Give one fact that you can determine from this graph?. Demographic Transition Model 10/29. Stages in Classic 4-Stage Demographic Transition Model (DTM) (Some books show a 3-stage model; others mention a new 5th stage).

E N D
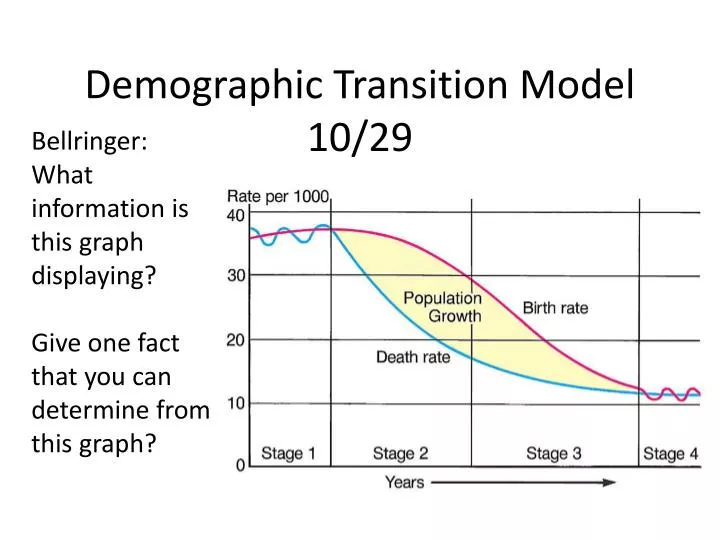
Bellringer: What information is this graph displaying? Give one fact that you can determine from this graph? Demographic Transition Model10/29
Stages in Classic 4-Stage Demographic Transition Model (DTM) (Some books show a 3-stage model; others mention a new 5th stage)
Stage 1: “Pre-Industrial” High birth rates and high death rates (both about 40) Population growth very slow Agrarian society High rates of communicable diseases Pop. increases in good growing years; declines in bad years (famine, diseases) No country or world region still in Stage One
Stage 2: “Early Industrial” High birth rates (over 30) but death rates decline (to about 20) RNIsincrease sharply (pop. explosion); growth rate increases throughout Stage Two Growth not from increase in births, but from decline in deaths MDCs = starts early 1800s LDCs = starts after 1950s
Why move from Stage 1 to Stage 2? • REMEMBER – the question is…. Why would more people live longer (lower CDR), NOT why would more people be born (higher CBR)?
TRANSITION TO STAGE TWO IN CLASSIC DTM Known as the Epidemiologic Transition Agricultural technology Improvements in food supply: higher yields as agricultural practices improved in “Second Agricultural Revolution” (18th century) In Europe, food quality improved as new foods introduced from Americas Medical technology Better medical understanding (causes of diseases; how they spread) Public sanitation technologies Improved water supply (safe drinking water) Better sewage treatment, food handling, and general personal hygiene Improvements in public health especially reduced childhood mortality
Stage 3: “Later Industrial” Birth rates decline sharply (to about 15) Death rates decline a bit more (to about 10 or less) Note growth still occurs, but at a reduced and declining rate MDCs = starts in late 1800s LDCs = starts after 1980s* * Or hasn’t started yet
Demographic Transition Model and Pyramids 10/30 Bell-ringer: Why move from Stage 2 to Stage 3? • REMEMBER – the question is…. Why would the birth rate drop rapidly once the CDR has been reduced? • Why would this happen at different times in MDC and LDC?
TRANSITION TO STAGE THREE IN CLASSIC DTM Known as the Fertility Transition Societies become more urban, less rural Declining childhood death in rural areas (fewer kids needed) Increasing urbanization changes traditional values about having children City living raises cost of having dependents Women more influential in childbearing decisions Increasing female literacy changes value placed on motherhood as sole measure of women’s status Women enter work force: life extends beyond family, changes attitude toward childbearing Improved contraceptive technology, availability of birth control But contraceptives not widely avail in 19th century; contributed little to fertility decline in Europe … Fertility decline relates more to change in values than to availability of any specific technology
Stage 4: “Post-Industrial” Birth rates and death rates both low (about 10) Population growth very low or zero (ZPG) MDCs = starts after 1970s LDCs = hasn’t started yet Much of Europe now or soon in population decline as birth rates drop far below replacement level
Why would different countries be able to transition through the DT at different rates?In other words, why does population increase (or decrease) at different rates in different countries?
Population Pyramids: 5 things you notice. What does this image show you?
Why would demographers be interested in graphing population in this way?
Analyze this graph: 5 things you notice. What is DIFFERENT about this pyramid?