Download
1 / 24
240 likes | 432 Views
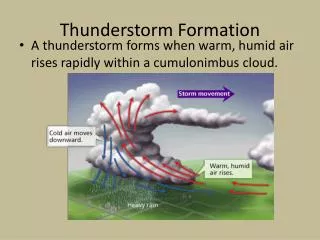
Thunderstorm Forecasting in NYC . Christina Speciale, Rutgers University Dr. Steven Decker, Rutgers University Brandon Hertell, Consolidated Edison. Agenda. Introduction Hypothesis Methodology Results Summary Future Work. Introduction. Introduction.

E N D
Thunderstorm Forecasting in NYC Christina Speciale, Rutgers University Dr. Steven Decker, Rutgers University Brandon Hertell, Consolidated Edison
Agenda • Introduction • Hypothesis • Methodology • Results • Summary • Future Work
Introduction • Meteorologists use atmospheric variables to forecast potential thunderstorm development & strength • Atmosphere measured 2x daily via weather balloon • 8am & 8pm (EDT) (12z & 00z)
Introduction • Variables provide insight to the state of the atmosphere • Standard ranges for these variables have been developed to forecast severe thunderstorms • Applied uniformly
Hypothesis Are standard t-storm variable ranges relevant in the NYC area? Potential customization of variables? Where and when do NYC t-storms occur? Synoptic features present? 7
Methodology • Build severe thunderstorm database • Events 2006-2009 • Within or near ConEdison service territory • Must include one or more of the following conditions • 58mph or above wind gusts • ¾”+ hail • Spawn tornado • Goal was 30 events, found 39
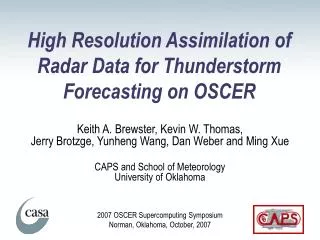
Methodology Albany Buffalo Chatham Upton Pittsburgh Sterling Sounding Locations Surface Analysis • Collect atmospheric and surface weather data • National Weather Service (NWS) • Storm Prediction Center (SPC) • Hydrometeorological Prediction Center (HPC) 10
Methodology • Organized and sorted data by • Time and location • Atmospheric variables • Synoptic features • Significant weather observed
Results 16
Results 18
Summary • Standard atmospheric variable ranges do not always apply in NYC • 2 of 7 variables • Potential customization – CAPE, LI, Total Totals, Helicity, SWEAT • June, July, August most likely months for severe weather • Westchester, Queens, & New York Counties had highest number of severe weather reports • Low pressure, cold fronts, & jet stream location are contributing factors to severe weather
Future Work • Match event timing to closest sounding • Narrow thunderstorm database further to the “most severe” events • Look for combinations or patterns between variables • Expand thunderstorm database • Find additional sounding information
Acknowledgement • Dr. Steven Decker, Associate Professor, Rutgers University • Brandon Hertell, ConEdison