Download
1 / 14
140 likes | 318 Views
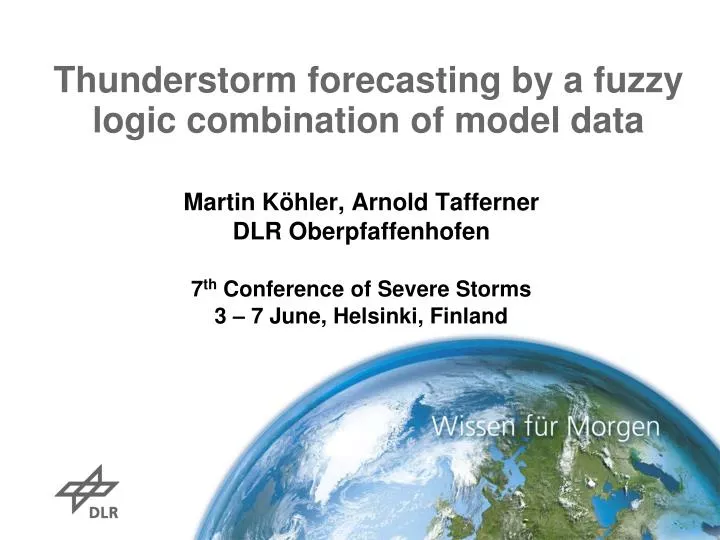
Thunderstorm forecasting by a fuzzy logic combination of model data. Martin Köhler, Arnold Tafferner DLR Oberpfaffenhofen 7 th Conference of Severe Storms 3 – 7 June, Helsinki, Finland. Hazards: heavy rain hail lightning strokes turbulence downdrafts. Effects (air traffic):

E N D
Thunderstorm forecasting by a fuzzy logic combination of model data Martin Köhler, Arnold Tafferner DLR Oberpfaffenhofen 7th Conference of Severe Storms 3 – 7 June, Helsinki, Finland
Hazards: • heavy rain • hail • lightning strokes • turbulence • downdrafts • Effects (air traffic): • reduced safety • reduced comfort • increased fuel consumption • redirections • cancellations • additional costs Photo by Martin Köhler • According to DFS (German Air Navigation Services) > 80 % of summertime delays at Munich Airport are induced by thunderstorms! • Demand for thunderstorm forecasts up to several hours ahead in time • which would enable decision makers to plan accordingly and to lessen the consequences
Data source: Output from COSMO-DE model v) Model area covers mainly Middle Euope • General notes: i) Non-hydrostatic forecasting model operational at DWD ii) 8 model runs per day: every 3 hours (0000 → 2100 UTC) iii) 421 x 461 grid points (resolution ~ 2.8 km) & 50 vertical levels iv) Output of about 100 fields in one-hour intervals Source: http://www.cosmo-model.org/
General notes: i) Capability to translate human reasoning based on imprecise data and fuzzy conception into mathematical decision making in a more appropriate way than binary logic ii) Fuzzy logic can handle the concept of partial truth (rejection of the wrong or right (0 or 1) concept smooth transition) iii) Application on complex, highly nonlinear processes Overview of fuzzy logic (2) (3) (1)
Step I: fuzzification → fuzzy input sets New fuzzy logic forecasting system i) CAPE ii) Omega (500 hPa) iii) Synthetic radar data iv) Synthetic satellite data (IR 10.9) - 3 fuzzy input sets per parameter derived from meteorological knowledge
New fuzzy logic forecasting system Step III : defuzzification fuzzy output sets Thunderstorm indicator Membership grade Transition from fuzzy input to fuzzy output sets with the „rule base“ (step II)
Step II: Rule base (If …. then decision rules) 81 rules(all possible combinations of the fuzzy input sets: 3^4) New fuzzy logic forecasting system - Each rule assigns a certain combination of the fuzzy input sets to a certain fuzzy output set → „rule book“ - Example: strongest rule IfsCAPE andsRadar andsOmega andlCTT then very strong Thunderstorm Indicator • Finally a symmetrical assignment of the 81 rules to the five fuzzy output sets is chosen!
New fuzzy logic forecasting system - Next step: calculation of the average weigth of all rules for each fuzzy output set Weighting of each fuzzy output set - Used method: Root-Sum-Square (RSS) Formular RSS: - Defuzzification (step III) Calculation of the averaged center of gravity of the weighted areas of the fuzzy output sets x - value is used as the defuzzificated number („Output Crisp Number“) Center of gravityi x Areai Method: Center of Gravity weighted CoG = Areai
New fuzzy logic forecasting system Thunderstorm indicator Example values: CAPE: 450 j/kg Omega: - 45 hPa/h CTT: 232 K Radar: 35 dBz Membership grade Thunderstorm indicator Thunderstorm indicator: 45.3
Example case: 22/06/2011 • Model run 1200 UTC – forecast beginning at 1400 UTC up to 1800 UTC • Comparison: fuzzy logic forecast ↔ COSMO - DE probability forecast* shown as coloured surfaces • Verification of the forecast with detected storms by radar (Rad-TRAM**) shown as blue contours *neighborhood method Theis et al. (2005) **Rad-TRAM = Radar – TRacking And Monitoring Kober & Tafferner (2009)
Example case: 22/06/2011 Fuzzy logic forecast COSMO – DE probability forecast 1400 UTC 1500 UTC
Example case: 22/06/2011 Fuzzy logic forecast COSMO – DE probability forecast 1600 UTC 1700 UTC
Example case: 22/06/2011 Fuzzy logic forecast COSMO – DE probability forecast 1800 UTC Conclusion: i) new forecasting system works quite well ii) fuzzy logic seems to better agree with the observations compared with the neighborhood method
Outlook i) Statistical analysis: Currently running for summer period of 2012 → Including object-based verification (lightning data) → Verification scores (POD, FAR...) ii) Operational application: Since 03/06/13 provided at Munich Airport → Available: 6 hours of forecast (hourly update) on a separate homepage → Aim: feedback of users iii) Tuning of the approach: → Weighting of the input parameters → Different fuzzy input sets (thresholds, overlaps) → Use of a best-time-member-ensemble Thank you for your attention! Contact: martin.koehler@dlr.de