Download
1 / 24
410 likes | 1.98k Views
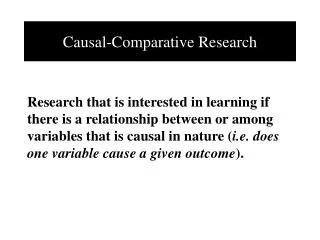
Causal-Comparative Research. Chapter Sixteen. Steps Involved in Causal-Comparative Research. Problem Formulation The first step is to identify and define the particular phenomena of interest and consider possible causes Sample

E N D
Causal-Comparative Research Chapter Sixteen
Steps Involved in Causal-Comparative Research • Problem Formulation • The first step is to identify and define the particular phenomena of interest and consider possible causes • Sample • Selection of the sample of individuals to be studied by carefully identifying the characteristics of select groups • Instrumentation • There are no limits on the types of instruments that are used in Causal-comparative studies • Design • The basic design involves selecting two or more groups that differ on a particular variable of interest and comparing them on another variable(s) without manipulation (see Figure 16.1)
Independent Dependent Group variable variable (a) I C O (Group possesses (Measurement) characteristic) II –C O (Group does (Measurement) not possess characteristic) (b) I C1 O (Group possesses (Measurement) characteristic 1) II C2 O (Group possesses (Measurement) characteristic 2) The Basic Causal-Comparative Designs
Examples of the Basic Causal-Comparative Design (Figure 16.1)
Threats to Internal Validity in Causal-Comparative Research • Subject Characteristics • The possibility exists that the groups are not equivalent on one or more important variables • One way to control for an extraneous variable is to match subjects from the comparison groups on that variable • Creating or finding homogeneous subgroups would be another way to control for an extraneous variable • The third way to control for an extraneous variable is to use the technique of statistical matching
Loss of subjects Location Instrumentation History Maturation Data collector bias Instrument decay Attitude Regression Pre-test/treatment interaction effect Other Threats
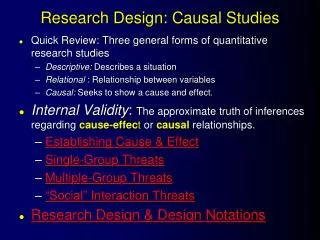
Evaluating Threats to Internal Validity in Causal-Comparative Studies • Involves three sets of steps as shown below: • Step 1: What specific factors are known to affect the variable on which groups are being compared or may be logically be expected to affect this variable? • Step 2: What is the likelihood of the comparison groups differing on each of these factors? • Step 3: Evaluate the threats on the basis of how likely they are to have an effect and plan to control for them.
Data Analysis • In a Causal-Comparative Study, the first step is to construct frequency polygons. • Means and SD are usually calculated if the variables involved are quantitative. • The most commonly used inference test is a t-test for differences between means. • ANCOVAs are useful for these types of studies. • Results should always be interpreted with caution since they do not prove cause and effect.
Survey Research Chapter Seventeen
What is a Survey? • Researchers are often interested in the opinions of a large group of people about a particular topic or issue. • There are three major characteristics that most surveys possess: • Information is collected from a group of people in order to describe some aspect of the population • Information is collected by asking questions of the members of the selected group • Information is collected from a sample rather than from every member of the population
Why Are Surveys Conducted? • The purpose of surveys is to describe the characteristics of a population. • Researchers find out how the members of a population distribute themselves on one or more variables. • A selected sample is surveyed and the description of the population is inferred from what is found out about the sample. • In descriptive surveys, researchers are not as concerned about why the observed distribution exists as with what the distribution is.
Types of Surveys • There are two types of surveys: • Cross-sectional survey • Collects information from a sample that has been drawn from a predetermined population • Information is collected at just one point in time, even though it could take days to gather all the data • A census is when the entire population is surveyed • Longitudinal survey • Information is collected at different points in time in order to study changes over time • Three types are employed: • Trend study • Cohort Study • Panel Study
Survey Research and Correlational Research • Techniques of Correlational Research can be tied in with Survey Research. • Researchers could look at the relationship of responses to one question (survey) to another, or of a score based on one set of questions to another set. • The use of calculating correlation coefficients or contingency tables could be determined and implemented.
Steps in Survey Research • The following steps are used in conjunction with performing proper surveys in research: • Defining the problem • Identifying the target population (unit of analysis) • Choosing the mode of data collection • Direct administration • Mail surveys • Telephone surveys • Personal interviews
Example of an Ideal vs. an Actual Telephone Sample for a Specific Question (Figure 17.1)
Steps in Survey Research(cont.) • The following steps are used in conjunction with performing proper surveys in research: • Selecting the sample • Preparing the instrument (questionnaire) • Closed-ended questions • Open-ended questions • Pre-testing the questionnaire • Format • Cover letter • Training interviewers
Non-response • In almost all surveys, some members of the sample will not respond. • Item non-response is due to unclear or questionable forms of wording. • Non-response is a serious problem in many surveys. • A variety of techniques are employed to reduce this problem (e.g., rewards or incentive for completing the surveys).
Data Analysis in Survey Research • After researchers receive the completed questionnaires, the task of summarizing the results remains. • The total size of the sample and total percentage of returns should be reported. • The percentage of the total sample responding for each item should be reported. • The percentage of respondents who chose each alternative for each question should be given.
In Pairs: • Each person should: • Summarize his/her study in 3 minutes or less. • Discuss explicitly the role of causality in each study (5 Minutes). • What in the design aids that causal argument? • What inhibits the causal argument? • Then read your partners methods section • Does it make sense? • Are steps in logical order? • Does it use proper terminology? • What threats to internal and external validity exist? • Repeat with the other person.
Basic Outline • Problem to be investigated • Purpose & Justification • Literature review • Theory and definitions • Hypotheses • Methods • Sampling • Including human subjects. • Instrumentation • How you will measure each IV and DV. • Be sure to identify IVs and DVs • Reliability & Validity • Design • Experiment, correlational, etc. • Procedural Detail • What will happen and when it will happen. • Data Analyses • Limitations • Internal and External.