Download
1 / 26
270 likes | 278 Views
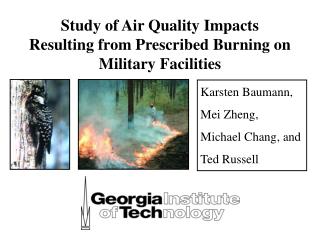
Air Quality Impacts from Prescribed Burning. Karsten Baumann, Venus Dookwah, Sangil Lee, Mei Zheng, Michael Chang, and Ted Russell. Funded in part by DoD/EPA/State P2 Partnership Small Grants Program. The Conflict. Clean Air Act. Endangered Species Act.

E N D
Air Quality Impacts from Prescribed Burning Karsten Baumann, Venus Dookwah, Sangil Lee, Mei Zheng, Michael Chang, and Ted Russell Funded in part by DoD/EPA/State P2 Partnership Small Grants Program
The Conflict Clean Air Act Endangered Species Act
Issues on Local to Global Scales Do prescribed burns reduce the risk of wild fires? In the continental U.S. prescribed burns and forest fires contribute ~37 % to the total direct fine PM emissions of ~1 Mio t per year* * Nizich et al., EPA Report 454/R-00-002 (NTIS PB2000-108054), RTP, NC, 2000 • Effects on • Health • Visibility • Air Quality • Climate
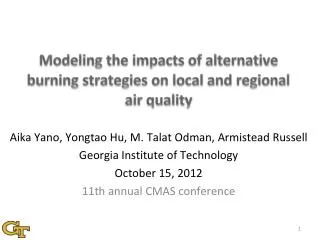
To what extent does prescribed burning impact local and regional air quality? O3, SOA VOCs NOx PM
Secondary organic aerosol (SOA): Organic compounds, some highly oxygenated, residing in the aerosol phase as a function of atmospheric reactions that occur in either gas or particle phases. SOA formation mainly depends on: Emissions & forming potential of precursors aromatics (BTX, aldehydes, carbonyls) terpenes (mono-, sesqui-) other biogenics (aldehydes, alcohols) Presence of other initiating reactants O3, OH, NO3, sunlight, acid catalysts Mechanisms (with half hr to few hr yields): Gas-to-particle conversion/partitioning e.g. terpene oxidation Heterogeneous reactions aldehydes via hydration and polymerization, forming hemiacetal/acetal in presence of alcohols Particle-phase reactions acetal formation catalytically accelerated by particle sulfuric acid (Jang and Kamens, ES&T, 2001)
15 14 Carbonyls Cyclic compounds 13 Branched Alkanes 12 n-Alkynes 11 Aromatics n-Alkanes 10 n-Alkenes 9 8 Mass Emission Rate (g/kg of biomass burned) 7 6 5 4 3 2 1 0 FPSP WGLP MHFF Pinus taeda Pinus ponderosa Tsuga heterophylla BUT also Primary PM Emissions from Foliar Fuel Combustion Hays, Geron et al., ES&T 36, 2281-2295, 2002 Biomass Litter Composites MHFF… mixed hardwood (oak) forest foliage FPSP… Florida palmetto & slash pine WGLP… wiregrass & longleaf pine
Diesel Exhaust 20% Gasoline Exhaust 3% Other Organic Carbon {SOA} 30% Vegetative Detritus 2% Meat Cooking 6% Wood Combustion 39% Source Contributions to Organic Carbon (OC) in Ambient PM2.5 Pensacola, FL October 1999 Measured average [PM2.5] = 16.6 mg m-3 [OC] = 4.6 mg m-3 Zheng et al., ES&T 2002
FAQS Observations: Regional Problem of PM2.5 Period 2001+ 02 MAY-OCT NOV-APR
Summer Winter PM2.5 Sources Near Columbus Driving Nighttime Averages in Winter 2001/02 Seasonal Differences in Diurnal Cycles: O3 & PM2.5
PM2.5 Eceedance at Columbus-OLC near Fort Benning for SE winds in Winter 2001/02 Despite regional character of PM2.5, local PM sources on military installations dominant in winter half.
Objectives and Outlook • In this initial pilot study, establish understanding of the direct and indirect impact of current burn practices on sub-regional Air Quality. • Lay foundation for more comprehensive and better focused Phase II Study to optimize burn practices toward minimum AQ impact. • Create results of general applicability for the benefit of LMBs on other military installations in the SE-US and beyond. • Learn lessons that help create and implement new revised land management strategies for the benefit of other agencies and institutions that face often times devastating wild fires in other parts of the Nation.
45’ x 40’ Fence 4’ 11’ 33’ x 7’ level Platform ~ 1’ above ground Guy wired 8m Tower tilt down 10’ x 12’ Shelter a/c 4 additional 20 A circuit breakers 4’ 14’ 3’ Stair step 4 quadruple outlets on individual breakers 8’ 10’ Gate N OLC site upgrade Research site at Oxbow Meadows Environmental Learning Center upgraded for PM source apportionment and in situ gas phase sampling
Particle Composition Monitor “PCM” Channel 1: NH3 Na+, K+, NH4+, Ca+2 Channel 2: HF, HCl, HONO, HNO3, SO2, HCOOH, CH3COOH, (COOH)2 F-, Cl-, NO3-, SO4=, HCOO-, CH3COO-, C2O4= Channel 3: EC, OC, WSOC, “SVOC” Additional higher resolutionCO, NO, NOy, O3,PM-mass, and basic meteorology
POC High-Vol Sampling and GC/MS Analyses Quantification of >100 Particle-phase Organic Compounds n-alkanes, branched alkanes, cycloalkanes n-alkanoic acids, n-alkenoic acids alkanedioic acids PAHs, oxy-PAHs retene steranes hopanes resin acids pimaric acid abietic acid sandaracopimaric acid aromatic acids levoglucosan
VOC Canister Sampling and GC/FID Detection of Volatile Organic Compounds Quantification of >60 compounds, incl. CO2 for “fire” samples Collaborating with Prof. Don Blake, UC Irvine, CA 92697 http://fsr10.ps.uci.edu/GROUP/group.html C2-C6 n-alkanes, alkenes, branched alkenes, alkynes isoprene Cyclic compounds monoterpenes (a-, b-pinene) Aromatics, organic nitrates, halogenated species methylchloride
4006 acres 3770 acres 1256 acres 937 acres No-Burn Background OLC Preliminary PM2.5 Mass & Composition January April 2003
PreliminaryResultsMarch 2003 Progressively increasing fine PM mass and organics fraction correlate with increased temperature, solar radiation, and O3, indicating increased oxidizing potential, hence formation of SOA.
Still to do • Evaluate regional PM from previous years relative to regional burn activity and precipitation • Collect few more PCM samples into summer • Analyze VOC samples • Analyze POC High-Volume samples • QA/QC all met, gas and PM data • Do source apportionment for select samples • Integrate ECMI met data from Ft Benning • Merge all AQ data with fuel data • Evaluate fuel-type – AQ relationship • Prepare data for model integration • Develop strategy for phase II
For more information • Dr. Karsten Baumann (PI) kb@eas.gatech.edu • Dr. Mei Zheng mzheng@eas.gatech.edu • Dr. Michael Chang chang@eas.gatech.edu • Dr. Ted Russell trussell@ce.gatech.edu Find this presentation as 030520 RWCA Seattle in ppt-format at http://arec.gatech.edu/Presentations
Acknowledgement Collaborators and Contributors CSU-OLC: Jill Whiting, Jim Trostle, site operators Becky Champion, director, “courier” Ft Benning: Polly Gustafson, EMD, reporting to J Brent Jack Greenlee, LMB, reporting to R Larimore Hugh Westbury, SERDP, contractor, reporting to D Price, US Army, Vicksburg, MS Ft Gordon: Allen Braswell, ENRMO, reporting to S Willard Augusta RP: Shari Mendrick, Col.Cty.Eng.Dept., Evans, GA
Gas-phase Emissions from Biomass Burning From laboratory combustion experiments by Lobert et al. [1990], published by Crutzen PJ and MO Andreae, Biomass burning in the tropics: impact on atmospheric chemistry and biogeochemical cycles, Science 250, 1669-1678, 1990. CO2, NOx, SO2, N2O, CH3Cl (not measured) mainly during flaming, CO, Nitriles (HCN, CH3CN), HC mainly during smoldering. Emission ratios (mol/mol) averaged for entire burning process: CO/NOx ~ > 25 CO/SO2 ~ 200 Lobert JM, DH Scharffe, WM Hao, and PJ Crutzen, Nature 346, 552-554, 1990.