Download
1 / 25
250 likes | 378 Views
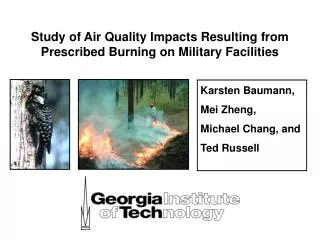
Study of Air Quality Impacts Resulting from Prescribed Burning on Military Facilities. Karsten Baumann, Mei Zheng, Michael Chang, and Ted Russell. Endangered Species Act. Clean Air Act. Fire Ecology.

E N D
Study of Air Quality Impacts Resulting from Prescribed Burning on Military Facilities Karsten Baumann, Mei Zheng, Michael Chang, and Ted Russell
Endangered Species Act Clean Air Act
Fire Ecology • The endangered Red Cockaded Woodpecker (RCW) resides only in the mature long-leaf pine forests of the SE US. • Most of the forests old and large enough to support the RCW are on federal and military lands. • Long-leaf pine ecosystems have adapted to natural fire regimes (wildfires in ~3 to 7 year cycles) and now require periodic burning to maintain health. • Prescribed burning is a safe and effective alternative to natural fire regimes.
To what extent does prescribed burning impact local and regional air quality? O3 VOCs NOx PM
Fine Particulate Matter (PM2.5) 30 min Average Concentrations during FAQS Phase II (Fall 2001) Motivation
Period around the prescribed burning of HC2 on 12/5/2001 Motivation
Period around the prescribed burning of Q1 on 3/28/2002 Motivation
Period around the prescribed burning of A9 on 5/21/2001 Motivation
HC2 Q1 A9
NH4 Other Elements Organic Compounds NO3 SO4 Elemental Carbon Motivation Average Composition of PM2.5 Observed During FAQS Phase I (July 2000) Columbus Oxbow Learning Center Columbus Water Works 2% 1% 28% 29% 1% 2% 57% 59% 9% 9% 2% 2% Average mass = 22 mg/m3 Average mass = 19 mg/m3
More Motivation In the continental U.S. prescribed burns and forest fires contribute ~37 % to the total direct fine PM emissions of ~1 Mio t per year* * Nizich et al., EPA Report 454/R-00-002 (NTIS PB2000-108054), RTP, NC, 2000 Zheng et al., ES&T 2002
Objectives • To quantitatively characterize pollutants emitted from prescribed burning, with emphasis on the detailed chemical composition of fine PM at OLC; • To study diversity of sites: - Fort Benning as primary study site, including PM source apportionment and in situ gas phase sampling. - Fort Gordon, Shaw and Eglin AFB as secondary study sites to include in situ gas phase sampling only. • To identify conserved markers for biomass burning in ambient air; • To determine the contribution of gaseous precursors towards secondary ozone and fine PM formation; • To determine how concentrations and chemical compositions differ with conditions of burning (such as open flame versus smoldering), type of biomass burned, moisture in the biomass, and season (summer versus fall).
POC 45’ x 40’ Fence PCM VOC 4’ 11’ 33’ x 7’ level Platform ~ 1’ above ground Guy wired 8m Tower tilt down 10’ x 12’ Shelter a/c 4 additional 20 A circuit breakers 4’ 14’ 3’ Stair step 4 quadruple outlets on individual breakers 8’ 10’ Gate N Met Fort Benning Gas • Focus on Fort Benning in collaboration with WW & CSU utilizing Columbus OLC site; • OLC site upgrade for PM source apportionment and in situ gas phase sampling started; • Contacts to site operators and VOC sample takers established, specific training in progress.
Particle Composition Monitor “PCM” Channel 1: NH3 Na+, K+, NH4+, Ca+2 Channel 2: HF, HCl, HONO, HNO3, SO2, HCOOH, CH3COOH, (COOH)2 F-, Cl-, NO3-, SO4=, HCOO-, CH3COO-, C2O4= Channel 3: EC, OC, WSOC, “SVOC” Additional higher resolutionCO, NO, NOy, O3, PM-mass, and basic meteorology
POC High-Vol Sampling and GC/MS Analyses Quantification of >100 Particle-phase Organic Compounds n-alkanes, branched alkanes, cycloalkanes n-alkanoic acids, n-alkenoic acids alkanedioic acids PAHs, oxy-PAHs retene steranes hopanes resin acids pimaric acid abietic acid sandaracopimaric acid aromatic acids levoglucosan
VOC Canister Sampling and GC/FID Detection of Volatile Organic Compounds Quantification of >60 compounds, incl. CO2 for “fire” samples Subcontract with long-term collaborator Prof. Don Blake, UC Irvine, CA 92697 http://fsr10.ps.uci.edu/GROUP/group.html C2-C6 n-alkanes, alkenes, branched alkenes, alkynes isoprene Cyclic compounds monoterpenes (a-, b-pinene) Aromatics, organic nitrates, halogenated species methylchloride
Fort Benning Polly Gustafson AQ Program Manager (706) 545-7576Polly.Gustafson@benning.army.mil Fort Gordon Stephen Willard AQ Program Manager (706) 791-2403willards@gordon.army.mil Shaw AFB Terry Madewell AQ Program Manager (803) 895-9996 Eglin AFB John Wolfe AQ Program Manager (850) 882-7677 john.wolfe2@eglin.af.mil Linking Chemical Composition of Emissions with Prescribed Burn Conditions… • Combustion: open flame versus smoldering • Biomass type and moisture • Seasonal differences: summer versus fall/winter • Site specific differences: background versus plume …Requires close collaboration with individual facilities’ personnel
BURN FORM • location & size of burn unit • phys & biol character • assets to protect • hazards & risks • personnel FIRE WEATHER INFO FORM • T, RH, WS, WD, BL height • fuel moisture, days since rain • O3 forecast, SDI • Photographs • Smoke Screening Form • Smoke Impact Map • Post Burn Monitoring Form Observations from smoldering phase?? Criteria, SOP and Documentation of PB • Burn map • Prioritized list • RCW data base • GIS digital system • FY table & summary • Drought conditions (KBDI) • Interagency communication • GFC Fire Weather Forecast Ignition Weather observations and T, RH, WS, WD measurements during peak fire (1200-1400 LT) • Delineation of burn area • Smoke Screening Procedure • Post-burn evaluation
Sampling Strategy • Met & gas-phase parameters are measured continuously at OLC. • PM & VOC samples are taken at OLC according to Ft Benning’s PB schedule. • Burn boss determines upwind/downwind location and takes 3 VOC samples: Upwind / Close to burn unit / Downwind [ Note, these samples don’t need to be taken simultaneously! ] • A maximum of 3 VOC samples are analyzed for each open flaming and smoldering/glowing stage; i.e. max 6 samples per burn. • Assuming that flaming stage ends at sunset when smoldering phase begins, problem is, how to coordinate the VOC can sampling for smoldering phase?? • Post-processing of continuous met & gas data, as well as local weather data will determine if OLC site can be considered upwind or downwind from burn unit; if indifferent, then neither VOC nor PM samples will be analyzed. • It is expected to capture 6 plume events, 4 in Fall 2002 and 2 in Summer 2003. • VOC analyses limited to max 36 VOC can samples.
Sampling Strategyrevised 9/13/02 • Met & gas-phase parameters are measured continuously at OLC. • PM & VOC samples are taken at OLC according to Ft Benning’s PB schedule. • Burn boss determines downwind location and takes 4 VOC samples: Before ignition / Close to flaming burn unit / Downwind / Upwind [ Note, these samples need/should not be taken simultaneously! ] • A maximum of 3 VOC samples are analyzed for - the full burn stage [most of the unit in open flaming], and - the late burn stage [most of unit in smoldering/glowing stage]; i.e. a total maximum of 8 VOC samples (incl. 2 upwind) are analyzed per burn. • Assuming that flaming ends at sunset when only smoldering occurs, problem is, how to coordinate the VOC can sampling for smoldering phase?? • Post-processing of continuous met & gas data, as well as local weather data will determine if OLC site can be considered upwind or downwind from burn unit; if indifferent, then neither VOC nor PM samples will be analyzed. • It is expected to capture 6 plume events, 4 in Winter 2002/03 and 2 in Spring 2003. • VOC analyses limited to max 48 VOC can samples.
VOC Can Sampling Technical Details • GUIDELINES FOR TAKING VOC AIR SAMPLES • Remove Yellow/black end cap from port connector. • Raise sample canister above and in front of you facing the wind. • When the canister is full, open the valve one full turn counter • clockwise, then close the valve firmly clockwise. • Fill out canister label and sampling record sheet provided. • Store boxes in a dry location with arrows up. • Please make a copy of the completed sampling record sheet • And mail to Air Resources Engineering Center • Georgia Institute of Technology • School of Earth and Atmospheric Sciences • 575 14th Street NW, lab 1376 • Atlanta, GA 30318 • Or fax to (404) 385-0795 • Please ship box with cans & documents back to • (use pre-printed label that should read) • Murray D C McEachern Department of Chemistry B35 Rowland Hall University of California, Irvine Irvine, CA, 92697-2025 Phone (949) 824-4854 • Fax (949) 824-2905
Deliverables and Products • Sep ’02 OLC site modifications, implementations, and preparations completed; • Dec ’02 1st progress report describing the sampling in Fall 2002; • Mar ’03 2nd progress report with prelim results of Fall sampling chemical analysis; • Aug ‘03 3rd progress report with detailed analysis of Fall ‘02 & Summer ‘03 results, including improved site specific prescribed burning emission factors; • Oct ‘03 Final Report with Recommendations, • reporting the detailed chemical composition and concentrations from prescribed burns, • comparing plume emissions to the background samples, • assessing the VOC emissions at three sites, and • identifying specific burning practices with resultant air quality impacts. • Beyond complement ongoing SERDP, State of GA, and US EPA research projects.
Deliverables and Productsrevised 9/13/02 • Oct ’02 OLC site modifications, implementations, and preparations completed; • Mar ’03 1st progress report describing the sampling in Winter 2002; • June ’03 2nd progress report with prelim results of Winter & Spring sampling; • Sep ‘03 3rd progress report with detailed analysis of Winter & Spring results, including improved site specific prescribed burning emission factors; • Dec ‘03 Final Report with Recommendations, • reporting the detailed chemical composition and concentrations from prescribed burns, • comparing plume emissions to the background samples, • assessing the VOC emissions at three sites, and • identifying specific burn practices with resultant air quality impacts. • Beyond complement ongoing SERDP, State of GA, and US EPA research projects.
For more information: • Dr. Karsten Baumann (PI) kb@eas.gatech.edu • Dr. Mei Zheng mzheng@eas.gatech.edu • Dr. Michael Chang chang@eas.gatech.edu • Dr. Ted Russell trussell@ce.gatech.edu