Download
1 / 16
160 likes | 215 Views
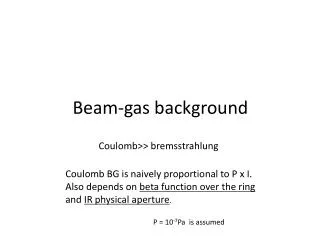
High rate beam test of Gas Detectors.

E N D
High rate beam test of Gas Detectors A.Andronic1, H.Appelshäuser1, V.Babkin2, P.Braun-Munzinger1, S.Chernenko2, D.Emschernmann3, C.Garabatos1, V.Golovatyuk2, J.Hehner1, M.Hoppe4, E.Jimenez1, M.Kalisky1, C.Lippmann1, D.Moisa5, F.Uhlig1, M.Petris5, M.Petrovici5, A.Radu1,5, V.Simion5, R.Simon1, H.-K.Soltveit3, J.Stachel3, H.Stelzer1, A.Wilk4, J.P.Wessels4, Yu.Zanevsky2, V.Zhezher2 and V.Zryuev2 1GSI Darmstadt; 2JINR Dubna; 3University of Heidelberg, 4University of Münster, 5NIPNE Bucharest Results of experimental data analysis taken on the SIS GSI beam are presented. As a prototype of TRD detector, four proportional chambers of different configurations and one GEM detector were used. The main goal of experiment was studying the behaviour of detectors response under irradiation by high intensity beams.
Description of the experimental setup Fig.1 Layout of the detector installation on the beam line Parameters of beam monitoring detectors
3mm 1mm 2mm 1mm 3 2 4 1 7 8 6 5 Active area of GEM 40 mm 10 25 50 mm Fig.2. Layout of MWPC prototypes. Left panel: chambers built at GSI and Bucharest, right panel: chamber built in Dubna. Mechanical parameters of MWPC’s used in the TRD test beam. Fig. 3. The scheme of the GEM detector used as a prototype for CBM TRD Holes are bi-conical with external diameter 70 μm, internal – 50 μm , pitch – 140 μm
Beam Intensity estimation 0.15 sec Fig.5. Beam intensity distribution during the spill. The figures represent the case when extraction time was 0.15 and 2.0 sec. 2.0 sec The information from the upstream scintillation counter which covers the beam also was used for a total beam intensity estimation. Number of counts in this counter happened in time from the previous trigger was recorded. Having in addition information from the clock about time between triggers we are able to recover the time structure of the beam passed through our detectors.
Average pulse shape from FADC (50 bins x 30 nsec) for different readout chambers and different spill length
Steps of Data Analysis • “Track” reconstruction with help of two Si (x and y strips with 50 μm pitch) stations. • Calculation expected track coordinate in each detector • Search for signals beyond the threshold around expected position • Calculation residuals R = Xexp – Xcoor • Calculation the total charge (sum up the signals from adjacent strips (pads)) • Calculation of center of gravity using signals from adjacent strips, (σ ~ 0.4 - 0.6 mm) • Check the track validity using addition coordinate information from proportional chambers • Selection of tracks which have small residuals on selecteted chambers. GSI-1 GSI-2 PC-Bucharest PC-Dubna GEM Si-1(x,y) Si-2(x,y) x x x x x x x x x x x x x
7 mm 30 mm Pads position of Dubna’s MWPC defined with Si “tracker” Pads position of GEM defined with Si “tracker” 3 mm 4 mm 10mm Strip position of GSI-1 chamber defined with Si “tracker”
GEM Ar/CO2 GEM Xe/CO2 Dubna Xe/CO2 Dubna Ar/CO2
Ar/CO2 Xe/CO2 GSI-1 GSI-1 GSI-2 Ar/CO2 Xe/CO2 GSI-2
Stability of the charge of signal from GEM and Dubna chamber vs beams intensity.
Stability of the charge of signal from GSI chambers vs beam intensity
Pad numbers distribution in Dubna Chamber (Ar/CO2) Dubna, X-direction Ar/CO2 Dubna, X-direction Ar/CO2 Dubna, Y-direction Ar/CO2 Dubna, Y-direction Ar/CO2 Dubna, Y-direction Xe/CO2
Space resolution vs beam Intencity (Dubna chamber)
Conclusions • We did not observe a gas gain degradation up to intensity of • 100 kHz/cm² in MWPCs with Ar/CO-2 and Xe/CO-2 mixtures. • We did not observe a spatial resolution worsening vs beam • intensity for Dubna chamber (with a small pad size). • A contribution of multiple scattering is significant in • obtained spatial resolution for MWPCs (especially for • Dubna chamber). • 3. Pad size of MWPC should be optimized for the next beam test
For the next Run we need to • Minimize a multiple scattering • Use fast 2D coordinate detectors for beam profile definition (GEM) • Provide beam intensity variation with a long spill length (2 sec) • Try to decrease size of the beam (1-2 cm² ). • Increase number of DAQ channels. Beam intensity 2 sec Beam extraction lenght