Download
1 / 1
10 likes | 156 Views
5-13 keV / 2-5 keV. Phase-Resolved Timing Analysis of GRS1915+105 in Its ρ State Shuping Yan, Na Wang, Guoqiang Ding Xinjiang Astronomical Observatory, Chinese Academy of Sciences yanshup@xao.ac.cn Na.Wang@xao.ac.cn dinggq@xao.ac.cn. 13-60 keV / 2-5 keV. Introduction. Results.

E N D
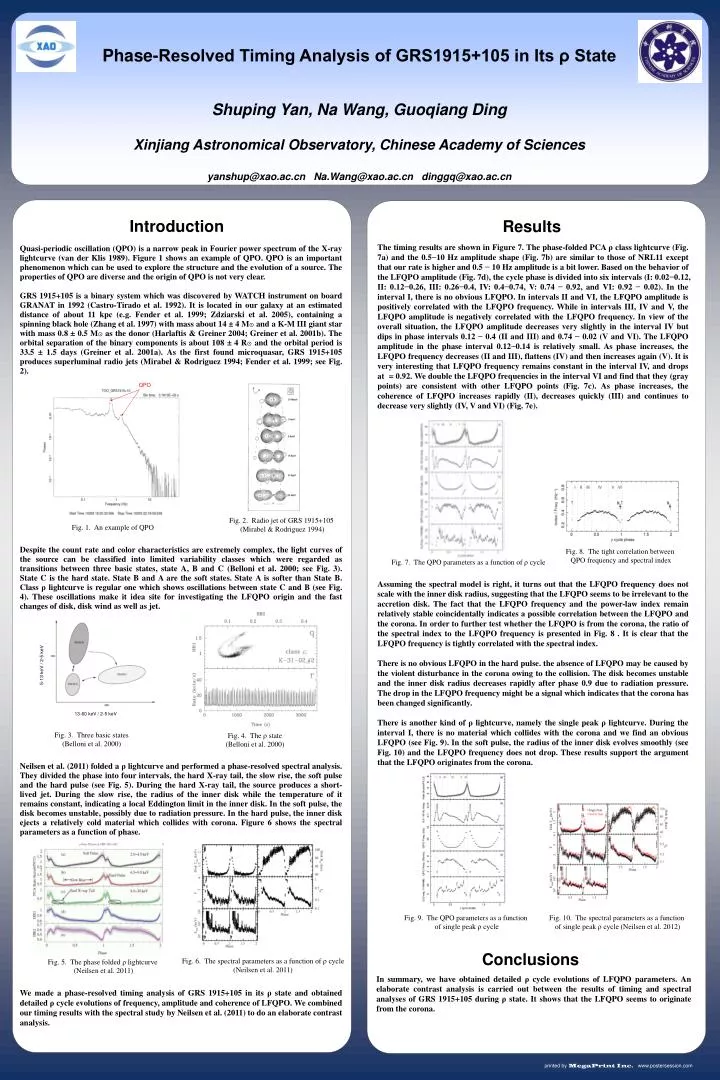
5-13 keV / 2-5 keV Phase-Resolved Timing Analysis of GRS1915+105 in Its ρ State Shuping Yan, Na Wang, Guoqiang Ding Xinjiang Astronomical Observatory, Chinese Academy of Sciences yanshup@xao.ac.cn Na.Wang@xao.ac.cn dinggq@xao.ac.cn 13-60 keV / 2-5 keV Introduction Results The timing results are shown in Figure 7. The phase-folded PCA ρ class lightcurve (Fig. 7a) and the 0.5−10 Hz amplitude shape (Fig. 7b) are similar to those of NRL11 except that our rate is higher and 0.5 − 10 Hz amplitude is a bit lower. Based on the behavior of the LFQPO amplitude (Fig. 7d), the cycle phase is divided into six intervals (I: 0.02−0.12, II: 0.12−0.26, III: 0.26−0.4, IV: 0.4−0.74, V: 0.74 − 0.92, and VI: 0.92 − 0.02). In the interval I, there is no obvious LFQPO. In intervals II and VI, the LFQPO amplitude is positively correlated with the LFQPO frequency. While in intervals III, IV and V, the LFQPO amplitude is negatively correlated with the LFQPO frequency. In view of the overall situation, the LFQPO amplitude decreases very slightly in the interval IV but dips in phase intervals 0.12 − 0.4 (II and III) and 0.74 − 0.02 (V and VI). The LFQPO amplitude in the phase interval 0.12−0.14 is relatively small. As phase increases, the LFQPO frequency decreases (II and III), flattens (IV) and then increases again (V). It is very interesting that LFQPO frequency remains constant in the interval IV, and drops at = 0.92. We double the LFQPO frequencies in the interval VI and find that they (gray points) are consistent with other LFQPO points (Fig. 7c). As phase increases, the coherence of LFQPO increases rapidly (II), decreases quickly (III) and continues to decrease very slightly (IV, V and VI) (Fig. 7e). Assuming the spectral model is right, it turns out that the LFQPO frequency does not scale with the inner disk radius, suggesting that the LFQPO seems to be irrelevant to the accretion disk. The fact that the LFQPO frequency and the power-law index remain relatively stable coincidentally indicates a possible correlation between the LFQPO and the corona. In order to further test whether the LFQPO is from the corona, the ratio of the spectral index to the LFQPO frequency is presented in Fig. 8 . It is clear that the LFQPO frequency is tightly correlated with the spectral index. There is no obvious LFQPO in the hard pulse. the absence of LFQPO may be caused by the violent disturbance in the corona owing to the collision. The disk becomes unstable and the inner disk radius decreases rapidly after phase 0.9 due to radiation pressure. The drop in the LFQPO frequency might be a signal which indicates that the corona has been changed significantly. There is another kind of ρ lightcurve, namely the single peak ρ lightcurve. During the interval I, there is no material which collides with the corona and we find an obvious LFQPO (see Fig. 9). In the soft pulse, the radius of the inner disk evolves smoothly (see Fig. 10) and the LFQPO frequency does not drop. These results support the argument that the LFQPO originates from the corona. Quasi-periodic oscillation (QPO) is a narrow peak in Fourier power spectrum of the X-ray lightcurve (van derKlis 1989). Figure 1 shows an example of QPO. QPO is an important phenomenon which can be used to explore the structure and the evolution of a source. The properties of QPO are diverse and the origin of QPO is not very clear. GRS 1915+105 is a binary system which was discovered by WATCH instrument on board GRANAT in 1992 (Castro-Tirado et al. 1992). It is located in our galaxy at an estimated distance of about 11 kpc (e.g. Fender et al. 1999; Zdziarski et al. 2005), containing a spinning black hole (Zhang et al. 1997) with mass about 14 ± 4 M⊙ and a K-M III giant star with mass 0.8 ± 0.5 M⊙ as the donor (Harlaftis & Greiner 2004; Greiner et al. 2001b). The orbital separation of the binary components is about 108 ± 4 R⊙ and the orbital period is 33.5 ± 1.5 days (Greiner et al. 2001a). As the first found microquasar, GRS 1915+105 produces superluminal radio jets (Mirabel & Rodriguez 1994; Fender et al. 1999; see Fig. 2). Despite the count rate and color characteristics are extremely complex, the light curves of the source can be classified into limited variability classes which were regarded as transitions between three basic states, state A, B and C (Belloni et al. 2000; see Fig. 3). State C is the hard state. State B and A are the soft states. State A is softer than State B. Class ρ lightcurve is regular one which shows oscillations between state C and B (see Fig. 4). These oscillations make it idea site for investigating the LFQPO origin and the fast changes of disk, disk wind as well as jet. Neilsen et al. (2011) folded a ρ lightcurve and performed a phase-resolved spectral analysis. They divided the phase into four intervals, the hard X-ray tail, the slow rise, the soft pulse and the hard pulse (see Fig. 5). During the hard X-ray tail, the source produces a short-lived jet. During the slow rise, the radius of the inner disk while the temperature of it remains constant, indicating a local Eddington limit in the inner disk. In the soft pulse, the disk becomes unstable, possibly due to radiation pressure. In the hard pulse, the inner disk ejects a relatively cold material which collides with corona. Figure 6 shows the spectral parameters as a function of phase. We made a phase-resolved timing analysis of GRS 1915+105 in its ρ state and obtained detailed ρ cycle evolutions of frequency, amplitude and coherence of LFQPO. We combined our timing results with the spectral study by Neilsen et al. (2011) to do an elaborate contrast analysis. QPO Fig. 2. Radio jet of GRS 1915+105 (Mirabel & Rodriguez 1994) Fig. 1. An example of QPO Fig. 8. The tight correlation between QPO frequency and spectral index Fig. 7. The QPO parameters as a function of ρ cycle Fig. 3. Three basic states (Belloni et al. 2000) Fig. 4. The ρ state (Belloni et al. 2000) Fig. 9. The QPO parameters as a function of single peak ρ cycle Fig. 10. The spectral parameters as a function of single peak ρ cycle (Neilsen et al. 2012) Conclusions Fig. 6. The spectral parameters as a function of ρ cycle (Neilsen et al. 2011) Fig. 5. The phase folded ρ lightcurve (Neilsen et al. 2011) In summary, we have obtained detailed ρ cycle evolutions of LFQPO parameters. An elaborate contrast analysis is carried out between the results of timing and spectral analyses of GRS 1915+105 during ρ state. It shows that the LFQPO seems to originate from the corona.