Download
1 / 33
360 likes | 1.3k Views
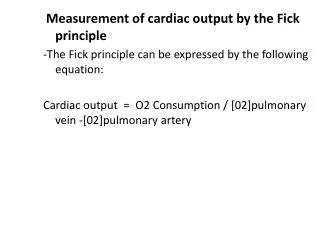
Measurement of cardiac output. Dr Kavitha Lakshman. University College of Medical Sciences & GTB Hospital, Delhi. Methods used for measurement of Cardiac Output. Invasive PA catheter - Fick’s cardiac output measurement - Thermodilution Technique

E N D
Measurement of cardiac output Dr Kavitha Lakshman University College of Medical Sciences & GTB Hospital, Delhi
Methods used for measurement of Cardiac Output Invasive PA catheter - Fick’s cardiac output measurement - Thermodilution Technique - Mixed venous oximetry pulmonary catheter Minimally invasive • Doppler Ultrasound • Lithium dilution cardiac output monitoring • Pulse contour cardiac output monitoring • Transpulmonarythermodilution Non-invasive • Bio impedence cardiac output monitoring • Partial carbon dioxide re breathing cardiac output monitoring
PULMONARY ARTERY CATHETERISATION • First used by Swan, Ganz for hemodymamic monitoring of patients • PAC can be placed from any central venous cannulation sites, but right internal jugular vein is most commonly used. • Standard PAC is 7.0 to 9.0 Fr in circumference, 110 cm long, has 4 internal lumens
INDICATOR DILUTION TECHNIQUE • Tracer substance is injected into the bloodstream – concentration change measured at a downstream site • Indocyanin green most commonly used dye • Stewart Hamilton Equation • I • Q = • ∫ CIdt • Where • Q = CO • I = Amount of indicator • ∫ CIdt = Integral of indicator concentration over time • Drawbacks of indicator dilution method • Limited to cardiac catheterization laboratories • Continuous withdrawal of arterial blood to plot the dye concentration curve • Dye needs regular injections (can accumulate)
Other guidelines for placement & waveforms were already discussed
Complication of PA catheterisation- Infection, endocarditis Thrombo embolism Endocardial damage, valve injury PA infarction PA rupture Catheter knotting Ventricular fibrillation, arrhythmia, RBBB
Bolus - Thermodilution Cardiac Output Monitoring • Variant of indicator dilution technique • Iced indicator/ room temperature indicator (bolus)- 10 ml or 0.15ml/kg in children • Advantages • Performed quickly, repeatedly • Does not require advanced diagnostic or technical skills • Uses non-toxic, non-accumulative indicator
Stewart Hamilton equation is modified (TB – TI) x K Q = ∫ TB (t) dt Where Q = CO TB= Blood temp. TI= Injectate temp. K = Computational constant ∫ TB (t) dt = Integral of temp. change over time
Method Volume of ice cold or room temperature fluid is injected as bolus Change in pulmonary artery blood temperature is recorded Source of error Intra or extra-cardiac shunt Tricuspid or pulmonary valve regurgitation Inadequate delivery of indicator Thermister malfunction Unrecognised blood temperature fluctuation Respiratory cycle influence
Continuous - Thermodilution CO monitoring Warm or cold thermal indicator Methods Release of small quantity of heat from a 10 cm thermal filament incorporated into right ventricular portion of a PAC approx. 15-20 cm from catheter tip Heating filament is cycled on & off Thermal signal measured CO derived from cross-correlation of measured pulmonary artery temp. Displayed value of CO is updated every 30-60 sec & represents the average value for cardiac output measured over 3-6 min
Advantages • External system for cold fluid injection is not required • Fewer measurement error • Less risk of fluid overload and infection • Measures average CO value - derived over several mins • Beat-to-beat variation in SV that occur during single respiratory cycle are equally represented In contrast bolus technique measures cardiac output values depending on phase of respiration
Doppler Ultrasound • Doppler principle • When USG waves strike moving objects, these waves are reflected back to their source at a different frequency, termed the Doppler shift frequency that is directly related to the velocity of moving object and the angle at which the USG beam strikes these objects • Red blood cells serve as moving object target
2 • Where • f = Doppler shift frequency • v = Velocity of red blood cell targets • f0 = Transmitted USG beam frequency • 0 = Angle b/w the USG beam and the vector of RBC flow • C = Velocity of USG in blood (approx. 1570 m/sec) • Cosine 0 = 1 as long as angle of insonation is small
SV = v x ET x CSA Where SV = Stroke volume v = Spatial average velocity of blood flow (cm/sec) ET = Systolic ejection time CSA = Cross-sectional area of vessel -Estimated CSA close to the mean value during systole obtained from a nomogram stored in the computer -Measured CSA using an M mode echo transducer incorporated in the probe
Types of probe-Suprasternal(Ascending aorta) Esophageal(Descending aorta) • Suprasternal probe position instability limited their use for extended period of time • Esophageal probes have 2 advantage over the suprasternal probe • Smooth muscle tone of the oesophagus maintains the probe position • It’s in close proximity to the aorta; thereby minimizing signal interference
The shape of the waveform allows Assessment of the venticular preload, afterload and contractility
PULSE CONTOUR CARDIAC OUTPUT MONITORING • Cardiac output is determined through analysis of arterial pressure wave form obtained from an arterial catheter or from a non invasive finger blood pressure waveform • CO is measured on a beat to beat basis • Wesseling and colleagues devised an algorithm for the calculation of SV from aortic impedence and changes in arterial pressure during systole • SV=∫ dP/dt Z
Advantage- • It has the potential for continuous, beat to beat monitoring of cardiac output Disadvantage- • Baseline calibration with known cardiac output is required • Recalibration is required every 8 to 12 hrs Require calibration to compensate for the algorithm’s inability to independently assess the ever changing effects of vascular tone • A well defined arterial pressure waveform is needed
Pulse contour cardiac output estimation without external calibration(Flo Trac) • Doesn’t require external calibration • The algorithm works on the principle that SV is directly proportional to pulse pressure and inversely proportional to aortic compliance • The aortic pressure is sampled at 100Hz analysed and updated every 20 sec • SV =K(SdAP) • The standard deviation-SdAP is proportional to the pulse pressure, which is proportional to SV. K is the constant derived from patient characteristics as described by Langewouler and co workers
BIOIMPEDENCE CARDIAC OUTPUT MONITORING • Developed by Kubiceck and NASA researchers in 1960s • Based on changes in electrical resistance of the thoracic cavity occurring with change in aortic blood volume during systole & diastole • 4Pairs -Each pair of electrode consists of a transmitting and a sensing electrode • Two pairs are applied to the base of the neck on opposite sides, two pairs are applied to the lateral aspect of the thorax at the level of the xiphoid process on opposite sides
The electrodes mark the upper and lower boundaries of the thorax An alternating current of low amplitude and high frequency is applied which is sensed by electrodes placed over the neck & lateral aspect of the chest. Volume of thorax is calculated according to the height, weight and gender
Advantage- Non invasive, continuous monitoring Measures thoracic fluid content, left ventricular ejection time, cardiac index Disadvantage- Susceptibility to electrical interference Relies on correct placement of the electrodes
References • Lailu M, Kalyan RK. Cardiac output monitoring. Annals of Cardiac monitoring.2008; 11:56-61 • Jhanji S, Dawson J and Pearse R M. Cardiac output monitoring:basic science and clinical application. Anaesthesia .2008; 172-78 • Rebecca A, Schroeder, Atilio B, Shahar B and Jonathan B. Cardiovascular Monitoring. Miller’s Anaesthesia: 7th edition: 1314-21 • William F Ganong, Review of medical physiology 22nd edition: 819 • Kaplan JA. Hemodynamic monitoring. Kaplan’s Cardiac Anaesthesia 5th edition: 283-86 • Edward Morgan.Patient monitors. Clinical Anaesthesiology 4th edition: 137-139