Download
1 / 56
600 likes | 849 Views
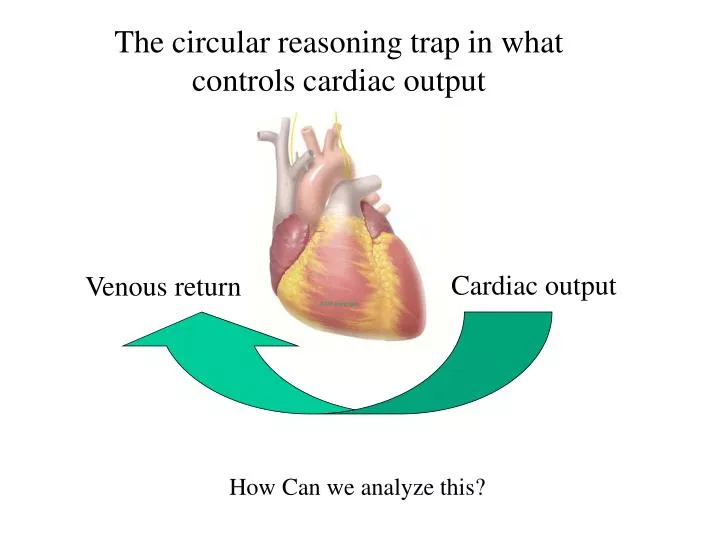
Cardiac output. Venous return. The circular reasoning trap in what controls cardiac output. How Can we analyze this?. Arthur Guyton found the answer. In his model the heart pumps blood out of the venous reservoir and puts it in the arterial reservoir.

E N D
Cardiac output Venous return The circular reasoning trap in what controls cardiac output How Can we analyze this?
In his model the heart pumps blood out of the venous reservoir and puts it in the arterial reservoir. Blood gets back to the veins by being forced across the peripheral resistance. Cardiac Output = SV * Heart Rate Peripheral flow = AOP/Peripheral Resistance
ΔP = R•CO Arterial Vol = (Cardiac output- Peripheral flow) dt Blood will accumulate in the arterial reservoir until the pressure is high enough to push blood across the peripheral resistance at the same rate as the cardiac output. AOP = Arterial Vol / Arterial Compliance Cardiac Output = SV * Heart Rate Peripheral flow = AOP/Peripheral Resistance Cardiac output = Peripheral flow
Arterial Vol = (Cardiac output- Peripheral flow) dt A change in pressure in a compartment must be due to a change in volume. Since there is a fixed amount of blood in the system any rise in volume on one side must be at the expense of volume on the other side. AOP = Arterial Vol / Arterial Compliance Venous Vol = Total Vol – Arterial Vol Cardiac Output = SV * Heart Rate Peripheral flow = AOP/Peripheral Resistance Cardiac output = Peripheral flow
The arterial reservoir has less compliance than the venous side. Thus a large change in arterial pressure causes a much smaller change in venous pressure Venous pressure = Venous Vol / Venous compliance
Arterial Vol = (Cardiac output- Peripheral flow) dt The venous pressure is the filling pressure for the heart (a primary determinant of stroke volume) How can we analyze this? AOP = Arterial Vol / Arterial Compliance Venous Vol = Total Vol – Arterial Vol SV = f(Venous pressure) Cardiac Output = SV * Heart Rate Peripheral flow = AOP/Peripheral Resistance Cardiac output = Peripheral flow
A rat is sacrificed and half of class studies his heart while the other half study the vascular system by replacing the heart with an electric pump
The half with the heart rediscovers the ventricular function curve: They find that cardiac output is determined by LVEDP
The other half finds that both arterial and venous pressure vary as a function of cardiac output. • At zero cardiac output venous and arterial pressure are the same. • When the pump is started the two pressures separate.
It is noted that both graphs have the same axis Venous pressure = LVEDP
Take the vascular curve and swap the axes so pressure is on the horizontal.
The pressure at zero cardiac output is called mean systemic filling pressure. Expand the pressure scale and throw away the arterial curve. venous pressure curve
If we connect the heart on the right to the blood vessels on the left what would the cardiac output be?
The solution is a simple simultaneous equation that we can solve graphically. There is only one cardiac output that can satisfy both systems. The crossing point determines that cardiac output.
If contractility is increased (symp. nerve stimulation) then cardiac output will rise and venous pressure will fall.
If contractility is decreased then cardiac output will fall and venous pressure will rise. Heart Failure
If total blood volume (TBV) is increased the venous pressure curve will be shifted up in a parallel fashion Cardiac Output Venous Pressure
Decreased blood volume (hypovolemia) will cause a parallel downward shift of the venous curve. Increased blood volume (hypervolemia) will cause shift in the curve upwards.
Loss of blood (hypovolemia) reduces cardiac output and venous pressure. If blood loss is large nothing will restore cardiac output except volume replacement It’s the low filling pressure that reduces the cardiac output. hemorrhagic shock The venous pressure distinguishes low contractility from hypovolemia
Because the venous resistance is small it has little effect on the peripheral resistance. At any given time most of the blood volume is in the veins. Constriction of the smooth muscle in the walls of the veins decreases venous compliance and raises venous pressure for any given venous volume.
Changing venous tone has the same effect as changing blood volume, a parallel shift in the venous pressure curve. Increased Venous Tone Decreased Venous Tone The lower curve shows venodilation where venous compliance (VC) is increased. While the upper curve is a venoconstriction.
Increased Venous Tone Constricting the veins increases venous pressure and cardiac output. Venoconstriction is a common way for the body to increase its cardiac output
Resistance is given by: ΔP/Flow . The major site of resistance in the periphery is in the arterioles. Only a small % of the blood volume is in the arterioles so changes in diameter do not shift the venous curves.
At zero flow increasing resistance has no effect on venous pressure When the heart is pumping increasing resistance will raise arterial pressure and lower venous pressure. The change will be proportional to the flow. Thus the rotation around the mean systemic filling pressure.
Decreasing the peripheral resistance causes a clockwise rotation of the venous pressure curve around the x axis intercept.
But wait there’s more! Decreased peripheral resistance by itself would increases filling pressure and increase cardiac output
Because the aortic pressure will fall, the heart will have an increased stroke volume for any filling pressure.
That will further increase cardiac output but will tend to lower venous pressure Because the aortic pressure will fall, the heart will have an increased stroke volume for any filling pressure.
An increased peripheral resistance will lower cardiac output. The overall effect on venous pressure is therefore ambiguous.
These are the only 4 maneuvers the body can use to alter the cardiac output! Contractility Blood volume Venous tone Arteriolar tone
Is determined by Interactions between the heart and the vasculature 2 CV mechanics Is determined by CNS and hormonal control systems 3 Control systems Stroke volume Three levels of Cardiac output regulation Is determined by Aortic & venous pressure 1 At the heart only contractility
The sympathetic nervous system cannot separately constrict the arterioles separate from the small veins. Yet arteriolar constriction reduces cardiac output while venous constriction increases it. What is the body trying to accomplish?
What would the control for activating the sympathetic nerves be labeled?
In this diagram the heart is represented as the right heart , the lungs and the left heart all together.
The two sides are automatically synchronized. If output from one side falls then the ventricle behind it will force blood into its atrium until its output matches the other ventricle.
CO = heart rate • stroke volume Theoretical In the normal range 50-180 b/min CO is independent of heart rate because cardiac output is primarily determined by the peripheral vasculature Real
CO = heart rate • stroke volume Theoretical CO falls dramatically at very low heart rates (< 50 b/min). Stroke volume is OK but the rate is too low Real
CO = heart rate • stroke volume Theoretical CO falls off at very high heart rates(> 180 b/min). Stroke volume decreases because diastolic filling time becomes too short. Real
In heart failure myocardial contractility is reduced to the point that the heart can no longer meet the needs of the body
The blood pressure then adjusts to maintain a balance between salt intake and loss NORMAL INTAKE HIGH INTAKE Because the curve is very steep a large increase in salt intake causes an insignificant increase in arterial pressure The rate at which the kidney loses sodium is determined by the blood pressure Output curve
NORMAL INTAKE If cardiac output is low due to failure, blood pressure will be low and the kidney will retain fluid in an attempt to restore it. Output curve Chronically lowpressure