Download
1 / 75
820 likes | 1.02k Views
Electrical Cardiometry for the measurement of cardiac output in pregnancy. Tom Archer, MD, MBA Clinical Professor and Director of Obstetric Anesthesia University of California, San Diego Modified June 19, 2013. Our Research Team. Tom Archer, MD, MBA Jerry Ballas, MD, MPH

E N D
Electrical Cardiometry for the measurement of cardiac output in pregnancy Tom Archer, MD, MBA Clinical Professor and Director of Obstetric Anesthesia University of California, San Diego Modified June 19, 2013
Our Research Team • Tom Archer, MD, MBA • Jerry Ballas, MD, MPH • Kristin Mantell, MD • Kristen Buono, MD • Thao Huyhn-Covey RDCS
Cardiac output in OB—why? Post-partum hemorrhage? Preeclampsia? Cardiomyopathy? Sepsis? Valvular heart disease? Anesthesia? Aortocaval compression? Obesity? Uterotonic titration? Study of normal events?
Cardiac output in OB—why not? Predominantly awake and healthy patients Happy, “normal” event (hopefully) Reduced tolerance for discomfort during personal, happy, normal event There has been no good technology to measure cardiac output comfortably, cheaply and continuously in awake patients!
But first, the bad news about Electrical Cardiometry… I am fascinated with this technology but it has several possibly insurmountable barriers to its being accepted…
“Problems” with electrical cardiometry (EC) • EC is too easy to use, both for operator and patient. • EC does not look impressive. • EC does not require bulky and intimidating equipment. • EC is not even slightly uncomfortable for the patient. • EC does not require advanced training.
“Problems” with electrical cardiometry (EC) • EC does not require assistants or technicians to obtain measurements and to clean and maintain the equipment. • EC does not required the placement of large tubes in large blood vessels.
“Problems” with electrical cardiometry (EC) • EC costs almost nothing on a per-use basis (four EKG patches). • EC does not require workshops in order to master it. • There is no American Society of Electrical Cardiometry (yet) for you to belong to and which will certify you so that you can have more cool letters behind your name such as “FASEC”. • EC is not fashionable (yet).
“Problems” with electrical cardiometry (EC) • But, the worst aspect of EC-- which probably makes it totally unacceptable to the medical community– is that: • EC involves mathematics and electricity.
All kidding aside… • Electrical cardiometry is a very promising technology which I believe may facilitate patient management not just in obstetrics, but in all of medicine…
Tolerated by awake OB patient? Continuous, hands-free data? Pain-free in awake patient? Easy to apply? Cardiac output method “Weird”? Pulmonary artery catheter No Yes No Maybe No Pulse contour analysis (Flo-Trac, LiDCO) No (arterial line required) Yes No Yes Somewhat Transesophageal echocardiography (TEE) No No No No No Transthoracic echocardiography (TTE) No No No Yes Yes Cardio-Q (esophageal Doppler VTI) Maybe Maybe No No No USCOM (sternal notch Doppler VTI) Yes Yes Maybe Sort of No Electrical cardiometry/ NICOM Yes Yes Yes Yes Yes
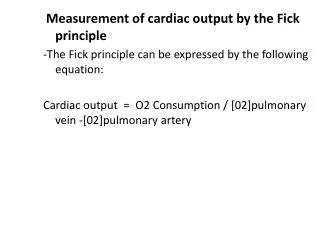
Stroke volume from “formal” TTE– one easy and one hard measurement. Easy (from LPSLAX view): Left ventricular outflow tract (LVOT) diameter, gives LVOT Area. Stroke volume is the volume of a cylinder: Base x Height = LVOT Area x Stroke distance Stroke distance Hard (from Apical view): Stroke distance = Velocity-Time Integral (VTI_TTE) VTI_TTE = Vmean_TTE x Envelope Time_TTE
BackgroundEchocardiography for Measuring Cardiac Output Π x LVOT Diameter2 4 Apical 5 chamber view with PW Doppler aligned with LVOT LVOT Area (cm2) Left parasternal long axis VTI = Distance Traveled by Blood through LVOT (cm) SV = VTI x LVOT area Tracing the envelope provides the Velocity-Time Integral (VTI) LVOT Diameter CO = SV x HR https://www.stanford.edu/group/ccm_echocardio/cgi-bin/mediawiki/index.php/Cardiac_output
Examples of high and low VTI. VTI– the “area under the curve”-- is the stroke distance.
Equivalent terms: stroke distance, velocity-time integral, or VTI SV_TTE = LVOT_Area * Vmean_TTE * Envelope_Time_TTE Equation for stroke volume from TTE.
Summary • Non-invasive, painless, continuous and inexpensive measurement of cardiac output might be useful in some pregnant patients (as well as in critical care in general). • Electrical cardiometry, without further modification, appears to identify trends in cardiac output in pregnant patients.
Summary • Electrical cardiometry, without further modification, appears not to give acceptably accurate absolute values of cardiac output in pregnant patients. • We propose modifications to electrical cardiometry in order to deliver absolute values of cardiac output with acceptable accuracy.
Summary • We propose two models for using left ventricular outflow tract diameter together with electrical cardiometry to acquire absolute values for stroke volume: • Model A • Model B
Summary • Model A uses left ventricular outflow tract diameter to “calibrate” the existing “off the shelf” measurement of stroke volume.
Stroke Volume from Model A A term involving the “off the shelf” estimate of stroke volume (SV_EC) by current electrical cardiometry. A term which “calibrates” the SV_EC to a specific LVOT area. SV_Model_A = (-17.4) + (0.356 x SV_EC) + (17.7 x LVOT_Area) A constant
Summary • Model B uses the fundamental electrophysiological parameters underlying electrical cardiometry to construct a “virtual velocity time integral”, which can be trended by itself, or– if absolute values for stroke volume are required– it can be multiplied by the LVOT area to acquire the absolute value of stroke volume. • Model B is attractive intellectually because it makes electrical cardiometry understandable– and testable– using the same mathematical model as “formal” transthoracic echocardiography.
EC parameters can be used to predict TTE parameters! Model B uses the underlying parameters of electrical cardiometry (height, weight, ICON and LVET_EC) to construct a “Vmean_EC” which is a prediction as to Vmean_TTE , and the LVET_EC which is prediction as to Envelope_Time_TTE. SQRT_ICON correlates with Vmean_TTE only when it is corrected for BMI, as shown here. SV_RM_B = K2 * SQRT_ICON / (16.8 – 0.2 * BMI) * LVET_EC SV_TTE = LVOT_Area * Vmean_TTE * Envelope_Time_TTE (Vmean_EC) It works! Hand-held TTE needed Yes! Yes! Stroke volume equation from TTE.
Clinical examples: Electrical cardiometry for trending cardiac output, ignoring absolute value.We compare measurements over time in a single patientEach patient is “her own control.”
Ballas et al SOAP 2012 SBG painful labor, no epidural. Uterine contractions, in the presence of an open inferior vena cava, cause increases in cardiac output, which we call: “autotransfusion waves.”
Ballas et al SOAP 2012 SBG painful labor: Increases in cardiac output are mostly due to increases in heart rate associated with pain– not due to increases in stroke index (SI).
Ballas et al SOAP 2012 Pt FEW. Pain free, epidural in place. “Autotransfusion waves” follow uterine contractions by about 40 seconds. Similar to patient SBG, except…
Ballas et al SOAP 2012 Pt FEW. Pain free, epidural in place. “Autotransfusion waves” are mostly due to increased stroke index (SI), not heart rate (HR).
Pt FEW. Epidural in place. Position change from right side down to left side down is associated with increased blood pressure and cardiac index and appearance of “autotransfusion waves”, which were absent prior to position change, despite occurrence of contractions. Also: position change is associated with increased contraction frequency. Does this denote improved uterine oxygenation and function due to relief of ACC? Archer TL, Shapiro AE, Suresh P. Anaesthesia and Intensive Care 2011 Mar;39 (2): 308-311, and Ballas et al SOAP 2012.
Uterine contractions in the presence of an open inferior vena cava cause “autotransfusion waves” of increased cardiac output, which follow the uterine contractions by 20-40 seconds.
Blockage of the inferior vena cava by the gravid uterus causes the overall cardiac output to decrease. Furthermore, autotransfused blood from uterine contractions cannot easily and quickly return to the heart and autotransfusion waves do not occur, or are decreased in amplitude.
Cesarean delivery and oxytocin administration usually cause increases in heart rate and cardiac output, along with modest increases in stroke volume. Archer TL, Conrad BE, Tarsa M, Suresh P. J Clin Anesth. 2012 Feb;24(1):79-82
Magnesium sulfate decreases systemic vascular resistance and increases cardiac output, but lowers blood pressure only slightly. Labetalol furthers decreases SVR and BP, and further increases CO. Archer TL, Conrad BE. Int J Obstet Anesth. 2011 Jan;20(1):91-2.
Hydralazine reduces systemic vascular resistance and blood pressure and increases cardiac output. Magnesium sulfate augments these tendencies. A decrease in fetal heart rate is reversed by patient’s adopting left side down position. Archer TL, Conrad BE. Int J Obstet Anesth. 2011 Jan;20(1):91-2.
Maternal position affects cardiac index and stroke volume at 26+3 weeks gestation in an asymptomatic patient. Could chronic aortocaval compression cause fetal problems during gestation? Maternal heart rate Archer TL, Suresh PJ, Ballas J. Ultrasound in Obstetrics and Gynecology 2011 Aug 11 doi: 10.1002/uog.10065 (Epub ahead of print).
Pt R 28 yo G2P0 at 35 weeks 5 days presenting with type I diabetes (since age 9) and severe pre-eclampsia. Patient had Cesarean section for severe pre-eclampsia and non-reassuring fetal heart rate. Patient had severe postpartum hemorrhage, but recovered after multiple blood transfusions and re-exploration for bleeding. Note small ventricular size during PPH, with increase in dimensions after recovery. During postpartum hemorrhage and hypotension, her heart rate never increased—possibly due to autonomic neuropathy? Archer et al SOAP 2013
Pt R– HR, SV and CO during post-partum hemorrhage and after recovery July 8----------------------------------------------- July 13 Archer et al unpublished. Pt R from SOAP 2013 poster
Electrical cardiometry for absolute value of cardiac output.Except for two slides which are noted, all measurements are from 23 laboring and non-laboring patients with their left side down and with time difference between TTE and EC measurements = or < 10 sec.
Single laboring patient 13 Percentage Error = 15.4 % in a single patient. Bland Altman Plot 30% upper limit = 1.5 mL Upper limit of agreement (Bias + 2 SD) = -8.8 mL Bias = -19.2 mL Limit of agreement (Bias - 2 SD) = -29.6 mL 30% lower limit = -39.9 mL
23 patients, 18 non-laboring and 5 laboring. Percentage Error = 45.6 %, before Model A Bland Altman Plot Upper limit of agreement (Bias + 2 SD) = 12.2 mL 30% upper limit = -1.4 mL Bias = -27.8 mL 30% lower limit = -54.2 mL Lower limit of agreement (Bias - 2 SD) = -67.8 mL
Our theory: within a single patient, SV_EC trends with SV_TTE. But between patients agreement of absolute values is poor.Is this due to varying LVOT diameters?
Calibrating electrical cardiometry using measured LVOT diameter: Model A 18 Non-laboring patients (91 data points) Develop Model A: SV_Model_A = -17.4 + 0.356*SV_EC + 17.7*LVOT_Area_cm2 TestSV_Model_A on the 5 laboring patients (391 data points)
Developing Model A in 18 non-laboring patients, 91 data points
18 non-laboring patients, 91 data points. Bland Altman analysis. Percentage error = 38.2 % Upper limit of agreement (Bias + 2 SD) = 17.9 mL 30% upper limit = 10.8 mL Bias = -15.3 mL 30% lower limit = -41.4 mL Lower limit of agreement (Bias - 2 SD) = -48.5 mL
Model A, which calibrates stroke volume estimation by electrical cardiometry using knowledge of the left ventricular outflow tract (LVOT) area– was developed from 18 non-laboring patients using step-wise linear regression. This term “scales” the EC estimate to a specific LVOT area. SV_Model_A = -17.4 + 0.356*SV_EC + 17.7*LVOT_Area_cm2
Model_A applied to 5 laboring patients After applying Model_A Before applying Model_A % error = 18.4 % % error = 18.9 %
Model B • Model B uses the fundamental electrophysiological parameters underlying electrical cardiometry to construct a “virtual velocity time integral”, which is then multiplied by the LVOT area to acquire the absolute value of stroke volume. • Model B is attractive intellectually because it makes electrical cardiometry understandable– and testable– using the same mathematical model as “formal” transthoracic echocardiography.