Download
1 / 48
500 likes | 1.38k Views
PRINCIPLES of HEMODYNAMICs – I basic principles pressure measurement cardiac output measurement. Basic principles PRESSURE MEASUREMENT CARDIAC OUTPUT MEASUREMENT.

E N D
PRINCIPLES of HEMODYNAMICs – Ibasic principlespressure measurementcardiac output measurement
Basic principles • PRESSURE MEASUREMENT • CARDIAC OUTPUT MEASUREMENT
Hemodynamics is concerned with the physical and physiological principles governing the movement of blood through the circulatory system. The forces involved with the movement of blood throughout the human circulatory system include: 1. Kinetic and potential energy provided by the cardiac pump 2. Gravity 3. Hydrostatic Pressure (weight of the liquid acting on a unit area at that depth plus any pressure acting on the surface of the liquid) 4. Pressure gradients or differences between two any points
Properties of blood itself that affect its flow: 1. Viscosity 2. Inertial mass(mass of an object measured by its resistance to acceleration) 3. Volume of blood to be moved • Factors that affect the motion of blood through the vascular conduits include: 1. Size of blood vessel 2. Condition of blood vessel 3. Smoothness of lumen 4. Elasticity of muscular layer (tunica media) 5. Destination of blood (distal vascular bed)
PRESSURE : force per unit area. Units : Newtons/m², pascal (Pa), atmospheres(atm), mmHg. FLOW RATE: Amount of fluid passing a given point over a given period of time VISCOSITY: The internal friction between adjacent layers of fluid. Blood is 1.5 times as viscous as water and its viscosity is directly related to hct level
KINETIC ENERGY: active energy , the energy of motion. In hemodynamics- described as the forward movement of blood. POTENTIAL ENERGY: stored energy. Kinetic energy is transferred into potential energy when it produces a lateral pressure or stretching of vessel walls during systole. The potential energy is converted back into kinetic energy when the arterial walls rebound during diastole.
Energy in the blood stream exists in three interchangeable forms: 1)pressure arising from cardiac output and vascular resistance 2)hydrostatic pressure from gravitational forces 3)kinetic energy of blood flow • TE = (perpendicular pressure + gravitational pressure) + kinetic energy TE = (P per + P grav) + ½ ρ V² • BP—lateral pressure, kinetic energy (also known as the impact pressure or the pressure required to cause flow to stop), and gravitational forces. • Kinetic energy- highest in aorta (< 5% contribution) • Gravitational forces - important in a standing person, minimal impact while supine • The intravascular pressure is responsible for transmural pressure(i.e. vessel distention) and for longitudinal transport of blood.
PRESSURE IN STATIC FLUIDS Pressure caused by liquid is α to the depth of the liquid & density pressure is exerted equally in all directions in a static liquid External pressure exerted on an enclosed liquid changes the overall pressure. Pascal’s Principle states that any change of pressure in an enclosed fluid is transmitted undiminished to all parts of the fluid.
PRESSURE IN FLOWING FLUIDS pressure in a flowing liquid depends on the details of the flow process, in contrast to the case of the static liquid • pressure gradient: pressure drop/ unit length. For a uniform horizontal tube the pg will be the same at all points in the tube if a perfectly uniform flow pattern is maintained Pressure gradient = P1 – P2 /L ( P1 = entry pressure,P2 = exit pressure, L = length of tubing) Drops in pressure during flow represent losses in energy. These losses are largely attributable to friction effects Viscosity- force that oppose the flow
POISEUILLE’S LAW predicts the volume of flow in moving fluids. Q= (P¹-P²)π r4 8ήl (Q = volume flow P1 = entry pressure P2 = exit pressure l = length of tubing r = radius of tube ή = viscosity of fluid) As pressure difference or diameter of vessel ↑, volume flow ↑ As length or viscosity ↑, volume↓ predicts volume flow under laminar flow conditions in straight tubes where wall friction is not a significant factor. FLOW RATE :
PRESSURE WAVE : • A complex periodic fluctuation in force per unit area. • A pressure wave is the cyclical force generated by cardiac muscle contraction. • Its amplitude and duration are influenced by various mechanical and physiological parameters 1) force of the contracting chamber 2) surrounding structures - contiguous chambers of the heart, pericardium, lungs, vasculature 3) Physiological variables - heart rate, respiratory cycle
Fundamental frequency: number of times the pressure wave cycles in 1 second • Harmonic: multiple of fundamental frequency
FOURIER ANALYSIS The complex waveform-(Fourier analysis)- • Mathematical summation of a series of simple sine waves of differing amplitude and frequency- harmonics • Fourier found that each pressure wave is a summation of a series of simple sine waves of differing amplitude and frequency
WIGGERS PRINCIPLE : The essential physiologic information is contained within the 1st 10 harmonics of the pressure wave’s Fourier series HR - 120/min Fundamental frequency- 2 Hz 10th harmonic- 20 Hz System with frequency response range upto 20 Hz suffice.
To record pressure accurately, a system must respond with equal amplitude for a given input throughout the range of frequencies contained within the pressure wave • If components in a particular frequency range are either suppressed or exaggerated by the transducer system, the recorded signal will be a grossly distorted version of the original physiologic waveform
Transducer • Amplifier • Recorder A pressure recording system is said to be adequate if the tenth harmonic of the fundamental frequency of a wave can be recorded with uniform sensitivity
THE ELECTRICAL STRAIN GUAGE-WHEAT STONE BRIDGE … converts pressure signal to electrical signal
FLUID-FILLED SYSTEMS • fluid-filled catheter attached to a pressure transducer • pressure wave is transmitted by the fluid column within the catheter • Pressure measurement system should have the highest possible natural frequency and optimal damping • Data should be collected with the patient in steady state, in close proximity to one another and before introduction of radiographic contrast. • Accurate ‘zero’ reference is essential • Transducers must be calibrated frequently (before each rec)
The pressure transducer - calibrated against a known pressure, and the establishment of a zero reference undertaken at the start of the catheterization procedure • To “zero” the transducer, the transducer is placed at the level of the atria, which is approximately midchest
Sources of Error in Pressure Measurement : (1)Tachycardia • If pulse is too fast for natural frequency of system, the fidelity of the recording will drop. • Pulse = 120 10th harmonic = 20 Hz Damped natural frequency should be at least 60 Hz (2)Deterioration in frequency response • Introduction of air or stopcocks permits damping and reduces natural frequency by serving as added compliance • When natural frequency of pressure system falls, high frequency components of the pressure waveform (intraventricular pressure rise and fall) may set the system into oscillation, producing “pressure overshoots”
(3)Sudden changes in pressure • Peak LV systole, trough early diastole, catheter bumping against wall of valve • Artifact seen due to underdamping (4)Catheter whip artifact • Motion of the catheter within heart or large vessels accelerates fluid in catheter and produces superimposed waves of 10 mm Hg (5)End-pressure artifact • Pressure from endhole catheter pointing upstream is artifactually elevated. When blood flow is halted at tip of catheter, kinetic energy is converted in part to pressure. Added pressure may range 2-10 mm Hg. • When endhole catheter is oriented into the stream of flow, the “suction” can lower pressure by up to 5%
(6)Catheter impact artifact • Pressure transient produced by impact on the fluid-filled catheter by an adjacent structure (i.e. heart valve) • Any frequency component of this transient that coincides with the natural frequency of the catheter manometer system will cause a superimposed oscillation on the recorded pressure wave
TERMINOLOGIES • PRESSURE MEASUREMENT • CARDIAC OUTPUT MEASUREMENT
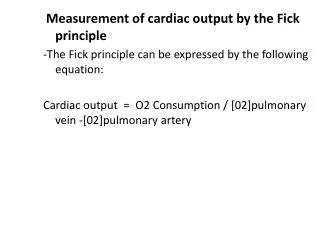
CARDIAC OUTPUT : Quantity of blood delivered to the systemic circulation per unit time … L/mt • Techniques • Fick-Oxygen Method • Indicator-Dilution Methods • Indocyanine Green • Thermodilution
Fick Oxygen Method: AV O2 Difference • Sampling technique • Mixed venous sample • Collect from pulmonary artery • Collection from more proximal site may result in error with left-right shunting • Arterial sample • Ideal source: pulmonary vein • Alternative sites: LV, peripheral arterial • If arterial dessaturation (SaO2 < 95%) present, right-to-left shunt must be excluded • Measurement • Reflectance (optical absorbance) oximetry
ASSUMPTIONS • Uptake of oxygen by the lungs from room air is measured instead of measuring the rate at which oxygen is taken up from the lungs by the blood (steady state : both are equal) • Left ventricular or systemic arterial blood is sampled instead of pulmonary venous blood • Due to bronchial venous and thebesian venous drainage, oxygen content of systemic arterial blood is 2 to 5ml/l lower than pulmonary venous blood
O2 consumption measurement : • Douglas bag method • Polarographic method • Paramagnetic method O2 consumption …..Assumed as • O2 consumption index – 125 ml / m2 (110 ml/ m2 for older pts) AV O2 difference: • The extraction of a given nutrient from the circulation is expressed as AV difference. • The factor by which AV diff can increase at constant flow -- extraction reserve • normal extraction reserve for oxygen - 3 • AV difference of O2 (resting state) : 30-40 ml/L
Relationship between AV O2difference (broken line) and cardiac index (solid curve) in normal subjects at rest (center) and during exercise (right), and in the patient with progressively worsening myocardial failure
INDICATOR DILUTION METHODS Merely a specific application of fick’s general principle 2 types : continuous-infusion method and the single-injection method. The single-injection method is the most widely used • Requirements • Bolus of nontoxic indicator ; mixes completely with blood ; its concentration can be measured accurately. • Indicator is neither added to nor subtracted from blood during passage between injection and sampling sites • Most of the indicator must pass the sampling site before recirculation begins • Indicator must go through a portion of central circulation where all the blood of the body becomes mixed
A specified amount of an indicator I is injected into a proximal vessel or chamber (e.g. the vena cava or right atrium for the thermodilution method and the pulmonary artery for the indocyanine green dye method) is followed by continuous measurement of the indicator concentration C in blood as a function of time, t , at a point downstream from the injection (e.g. pulmonary artery for thermodilution technique and radial or femoral artery for the indocyanine green dye method).
STEWART-HAMILTON EQUATION Indicators used : • Indocyanine Green (previously used) • Thermodilution (Indicator = Cold)
Indocyanine green (volume and concentration fixed) injected as a bolus into right side of circulation (pulmonary artery) • Samples taken from peripheral artery, withdrawing continuously at a fixed rate • Indocyanine green concentration measured by densitometry • CO=I/C x t
Amount of dye added = 5 mg • Average dye concentration = 2 mg/L • Therefore the volume that diluted the dye = 5mg/2mg per L = 2.5 L • Time it took to go past = 0.5 min • ie flow rate = 2.5 L /0.5 min = 5 L/min General equation: • Flow rate = mass of dye average dye conc (X g/L) x time of passage (t min)
Sources of Error • Indocyanine green unstable over time and with exposure to light • Sample must be introduced rapidly as single bolus • Bolus size must be exact • Indicator must mix thoroughly with blood, and should be injected just proximal or into cardiac chamber • Dilution curve must have exponential downslope of sufficient length to extrapolate curve. Invalid in Low cardiac output states and shunts that lead to early recirculation • Withdrawal rate of arterial sample must be constant
THERMODILUTION METHOD : • Fegler1954 (CONSERVATION OF ENERGY) • cold saline or 5% D • balloon-tipped flow-directed pvccatheter • thermistor at tip • opening 25 to 30 cm proximal to the tip • Via vein to PA (proximal opening –SVC or RA, thermistor –PA) • 5 to 10 mL to proximal port • change in temperature at the thermistor recorded
area under the curve is inversely proportional to the flow rate in the pulmonary artery which equals the cardiac output in absence of intracardiac shunt
Sources of Error (± 15%) • Unreliable in tricuspid regurgitation • Baseline temperature of blood in pulmonary artery may fluctuate with respiratory and cardiac cycles • Loss of injectate (cold) b/w the injn site & measuring site …… with low CO states (CO < 3.5 L/min) due to warming of blood by walls of cardiac chambers and surrounding tissues. The reduction in TB at pulmonary arterial sampling site will result in overestimation of CO. • Empirical correction factor (0.825) may be inadequate to correct for deviations in true injectate temperature … owing to warming in the syringe by the hand of the individual injecting the dextrose solution from the syringe or by catheter warming.