Download
1 / 25
250 likes | 340 Views
Methods for Incorporating Lightning NO x Emissions in CMAQ. Ken Pickering – NASA GSFC, Greenbelt, MD Dale Allen – University of Maryland, College Park, MD Rob Pinder and Tom Pierce – US EPA, Research Triangle Park, NC. Motivation for Including Lightning NO x in CMAQ.

E N D
Methods for IncorporatingLightning NOx Emissionsin CMAQ Ken Pickering – NASA GSFC, Greenbelt, MD Dale Allen – University of Maryland, College Park, MD Rob Pinder and Tom Pierce – US EPA, Research Triangle Park, NC
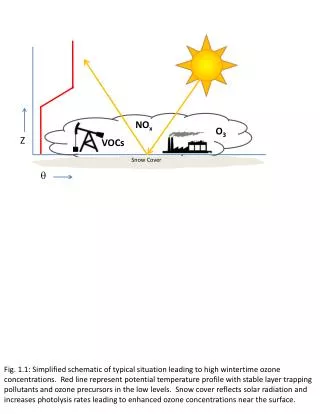
Motivation for Including Lightning NOx in CMAQ • Production of NO by lightning (LNOx) is an important part of the tropospheric NOx budget (tropical UT: >70% over broad regions; summer US: 20-60%), but it is also the most uncertain component. • Global annual lightning NO production has been estimated to be 2-8 Tg N/yr (Schumann and Huntrieser, 2007). • Global CTMs estimate impact of LNOx on surface O3 to be several ppbv on average. • In most of the free troposphere O3 production rates are highly sensitive to NOx mixing ratios. The maximum effectiveness of ozone as a greenhouse gas is in the UT/LS. • Comparison of CMAQ tropospheric column NO2 with aircraft observations shows low bias in model. LNOx source needed. • Lightning observations from surface networks and satellites are being used in conjunction with cloud-resolving, regional and global models in attempts to further reduce the LNOx uncertainty.
When paired with aloft measurements from NASA INTEX, CMAQ underpredicts NO2 above the mixed layer Consistent on all flights during the summer of 2004 On average 1.07 (1015 molecules cm-2) Missing NO2 Aloft Pinder et al., 2008
Requirements for Specifying Lightning NO Production in Regional Chemical Transport and Climate Models • Flash rates need to be estimated for the times and locations for which parameterized deep convection is active in the model. Based on best fit between MM5 convective precipitation and observed flashes from National Lightning Detection Network (NLDN) • An estimate of average LNOxproduction per flash Based on cloud/chemistry model simulations for observed midlatitude and subtropical thunderstorm events • A method of specifying the effective vertical distribution of LNOx Based on average profile of flash components from 3-D Lightning Mapping Array (LMA) data
CMAQ Lightning Parameterization F = G * αi,j * (preconi,j – threshold), where precon is the convective precipitation rate from MM5 threshold: A value of precon below which the flash rate is assumed to equal zero. G is a global scaling factor chosen so that the domain-averaged MM5 flash rate matches the domain averaged observed flash rate. αi,j is a local adjustment factor chosen so that the monthly avg model-calculated flash rate for each grid box equals the observed monthly avg flash rate at each grid box. Note: Threshold is chosen so that when averaged over each month and all 279x240 MM5 grid boxes, the frequency of MM5-calculated lightning = the frequency of observed (NLDN) lightning. (The threshold for June 2006 was 0.32 cm hr-1).
Processing of NLDN flash rates Raw NLDN data sets contain time sequence of CG flashes over the US. Create Hourly Time Series for Total Flashes Interpolate monthly average IC/CG ratios onto 279x240 CMAQ grid by using values from 0.5°x0.5°4-year data set of Boccippio et al. (2001) After adjusting for detection efficiency, map raw NLDN CG flash rates onto hourly CMAQ grid. Multiply by (IC/CG +1) to obtain total “observed” flash rate. Create time series of hourly total flash rate on the 279x240 CMAQ grid. Create Monthly Time Series of Total Flashes Create time series of monthly average NLDN flash rate (CG flashes only) on the 279x240 CMAQ grid. Multiply by IC/CG+1 to obtain time series of monthly avg total flash rate [Fdata(i,j)]. For each month, calculate the fraction of grid boxes with lightning at any given time
Boccippio et al., 2001 Based on NLDN CG flashes and OTD/LIS total flashes
Determination of adjustment factors Using hourly precon values from MM5, calculate the monthly mean nominal flash rate at each CMAQ grid box, where Fnominal(i,j) = G * Σ (precon(i,j) – threshold)/ N. Sum over N the number of hours with NLDN observations in that month. Calculate the adjustment factor at each grid box: α(i,j) = Fdata(i,j) / Fnominal(i,j) Factors mostly in range 0.3 to 6. Set adjustment factor to 1 at CMAQ grid boxes that did not have deep convection at any time during that month. Using appropriate adjustment factors calculate flash rate (F = G * αi,j * [preconi,j – threshold]) at individual grid boxes.
August 2006 R = 0.64 Sept. 2006 R = 0.69
August 2006 Sept. 2006
August 2006 Sept. 2006
LNOx Production Per Flash • Cloud resolved chemistry modeling (DeCaria et al., 2000; 2005; Ott et al., 2005; 2007) of observed convective events from field experiments (STERAO, EULINOX, CRYSTAL-FACE) has indicated a mean of 500 moles N per CG flash in midlatitudes and subtropics. • LNOx production per IC flash approximately equal to that from a CG flash on average. • These values have been used in other global and regional simulations over North America (GEOS-Chem, FLEXPART, REAM) and have provided good comparisons with NOx observations.
Lightning NO Production Scenarios Summary of Five Midlatitude and Subtropical Storms Orville et al., 2002 Means: 500 moles/flash 0.93 ratio For global rate of 44 flashes/sec, this implies ~9 Tg N/yr
Vertical partitioning of lightning-NO emissions • Use vertical distribution of lightning channels observed by 3-D Lightning Mapping Arrays (LMA) as guidance in distributing LNOx vertically. LNOx production also assumed to be proportional to pressure. • Place lightning-NO emissions in all model layers from the surface-layer to the layer that contains the cloud top (predicted by convective scheme in CMAQ). The fraction of emissions placed into each model layer depends on the depth of the layer relative to the depth of the convective cloud. • Create look up tables for various cloud depths. • Use the look up tables and the cloud-top-layer time series to create a time series of 3-d lightning-NO emissions. • Create a netcdf file of these emissions for desired time period to be read into CMAQ.
Vertical Distribution of VHF Sources – Northern Alabama Lightning Mapping Array Apr.-Sept. 2003-2005 D. Buechler, NASA/MSFC
Summary and Future Work • Use of MM5 convective precipitation rates along with local scaling factors based on NLDN observations yields realistic lightning flash rates for use in developing 3-D LNOx emissions for CMAQ that are consistent with model convection. • Appropriate temporal and geographic variability in flash rates has been demonstrated for Summer 2006. • Next steps: Assemble 3-D emission data set Conduct test runs of CMAQ with LNOx source for comparison with runs without lightning Comparisons of CMAQ NOx and O3 output with aircraft and ozonesonde data; CMAQ NO2 with OMI tropospheric column NO2 from NASA Aura satellite Evaluate IC/CG ratios using LMA data
OMI Lightning NO2 (LNO2) Analyses Case Study: June 3, 2005 Maximum NO2 over Iowa OMI Cloud Fraction Level 2 OMI Tropospheric NO2 OMI Level 2 trop. NO2 data used to estimate NOx production per flash: Back trajectories run at several levels to determine number of upwind flashes: 2.35 x 10⁶ moles/15,986 flashes = 474 +/- 125 moles per flash This value is comparable with estimates from cloud- resolved modeling for storms over the US: 500 moles/flash on average 2.35 +/- 0.618 x 10⁶ moles NO2 1.64 +/- 0.617 x 10⁶ moles NO2 LNO2 on 0.25 x 0.25 degree grid
Summary and Future Work • Use of MM5 convective precipitation rates along with local scaling factors based on NLDN observations yields realistic lightning flash rates for use in developing 3-D LNOx emissions for CMAQ that are consistent with model convection. • Appropriate temporal and geographic variability in flash rates has been demonstrated for Summer 2006. • Next steps: Assemble 3-D emission data set Conduct test runs of CMAQ with LNOx source for comparison with runs without lightning Comparisons of CMAQ NOx and O3 output with aircraft and ozonesonde data; CMAQ NO2 with OMI tropospheric column NO2 from NASA Aura satellite Evaluate IC/CG ratios using LMA data
Acknowledgments NASA Modeling, Analysis and Prediction (MAP) and Aura Validation Programs NASA Applied Sciences Air Quality Program