Download
1 / 15
190 likes | 405 Views
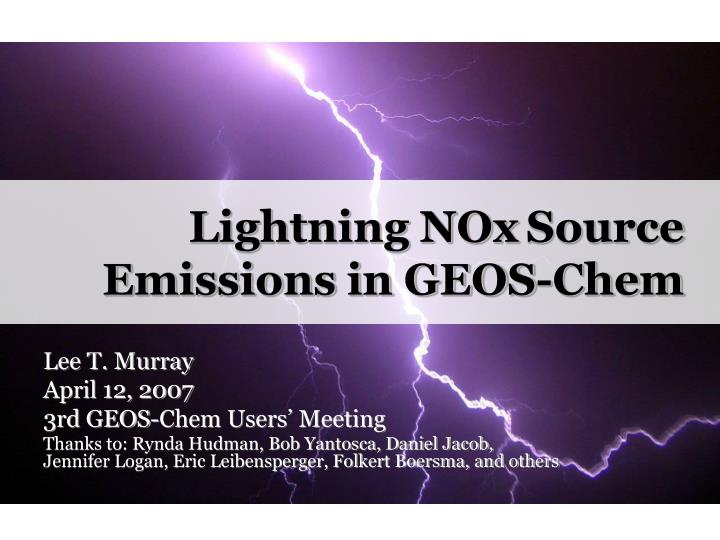
Lightning NOx Source Emissions in GEOS-Chem. Lee T. Murray April 12, 2007 3rd GEOS-Chem Users’ Meeting Thanks to: Rynda Hudman, Bob Yantosca, Daniel Jacob, Jennifer Logan, Eric Leibensperger, Folkert Boersma, and others. NOx O 3. Current Annual NO x Source. Tg N/yr. Fossil Fuel Burning.

E N D
Lightning NOxSource Emissions in GEOS-Chem Lee T. Murray April 12, 2007 3rd GEOS-Chem Users’ Meeting Thanks to: Rynda Hudman, Bob Yantosca, Daniel Jacob, Jennifer Logan, Eric Leibensperger, Folkert Boersma, and others
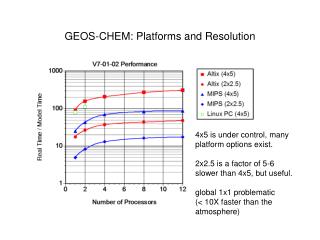
NOx O3 Current Annual NOx Source Tg N/yr Fossil Fuel Burning 28-32 (28) Biomass Burning 4-24 (10) Model Obs Lightning 1-20 (5-7) Soil Emissions 1-16 (5.5) Aviation 0.7-1 (0.7) N2O Degradation 0.1-1 (0.4) Total ~50 0.0 0.2 0.4 0.6 0 20 40 60 80 100 ppbv ppbv [Hudman et al 2007a] [Schumann and Huntrieser 2007] Lightning:An Important Source of NOx Lee T. Murray Harvard Atmospheric Chemistry Modeling Group
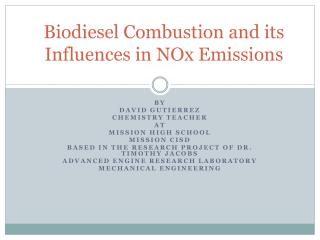
Global Lightning Distribution Optical Transient Detector (May 1995 -- Mar 2000) Lightning Imaging Sensor (Dec 1997 -- present) Combined HR Monthly Climatology Lee T. Murray Harvard Atmospheric Chemistry Modeling Group flashes / sec / box
Original Scheme(pre-v7.02.04) Lee T. Murray Harvard Atmospheric Chemistry Modeling Group
6 Tg N / yr [Martin et al 2002] [Pickering 1998] [Price and Rind 1992] LNOx Parameterization Scaled to CTH Lee T. Murray Harvard Atmospheric Chemistry Modeling Group
Flashrate Parameterization CTH Flashrate parameterization of Price and Rind [1992] Fcontinental CTH4.9 Fmarine CTH1.73 Z_IC CC IC/CG Ratio parameterization of Price and Rind [1993] IC-CG Ratio CC4.0 Z_CG Lee T. Murray Harvard Atmospheric Chemistry Modeling Group
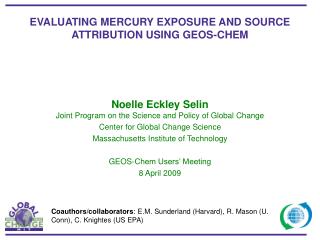
Alternative Schemes CTH MFLUX PRECON flashes/sec/box July OTD-LIS July 2004 flashes/sec/box flashes/sec/box • MFLUX and PRECON params [Allen and Pickering 2002] recreate global distribution poorly with GEOS4 fields • CTH [Price and Rind 1992] (including near-land) fits overall distribution but fails to capture relative flash rates flashes/sec/box Lee T. Murray Harvard Atmospheric Chemistry Modeling Group
Regional Redistribution • Scaling done at regional level allows model to drive interannual flashrate variability • “v1” & “v2” redistribution product: 15 monthly regions with Lee T. Murray Harvard Atmospheric Chemistry Modeling Group
Improvements from Redist NO SCALING REG SCALING July 2004 Increased Obs-to-Model correlations in lightning flash rate, particularly during summer months But rectilinear regions create discontinuities and OTD-LIS July Lee T. Murray Harvard Atmospheric Chemistry Modeling Group
Improved Regional Redistribution k-means clustering: Comp. efficient algorithm to allow data-driven regional selection by iteratively minimizing distances between all data and k cluster centroids in an n-dimensional space k = 20 20 total regions in space and time based on proximity in month, OTD-LIS(1995-2005 avg.) obs, GEOS-Chemoutput (1995-2005 avg.), and latitude. Lee T. Murray Harvard Atmospheric Chemistry Modeling Group
Improved Regional Redistribution k-means clustering: Comp. efficient algorithm to allow data-driven regional selection by iteratively minimizing distances between all data and k centroids in an n-dimensional space k = 20 20 total regions in space and time based on proximity in month, OTD-LIS(1995-2005 avg.) obs, GEOS-Chemoutput (1995-2005 avg.), and latitude. Lee T. Murray Harvard Atmospheric Chemistry Modeling Group
Improved Regional Redistribution k-means clustering: Comp. efficient algorithm to allow data-driven regional selection by iteratively minimizing distances between all data and k centroids in an n-dimensional space k = 20 20 total regions in space and time based on proximity in month, OTD-LIS(1995-2005 avg.) obs, GEOS-Chemoutput (1995-2005 avg.), and latitude. Lee T. Murray Harvard Atmospheric Chemistry Modeling Group
k-means Clustering Significant improvement in overall distribution and preventing discontinuities, while drastically reducing annual number of regions from 12 x 15 = 180 (v2) to 20 (v3). OTD- LIS v2 v3 Lee T. Murray Harvard Atmospheric Chemistry Modeling Group
“Clustered” Redistribution Averaged model to climatology R= 0.92 Flashes/km2/6hr * 500 mol/fl in the N Midlats [Hudman et al 2007a] * 280 mol/fl in the tropics to match 4.4Tg tropics [Martin et al 2007] Lee T. Murray Harvard Atmospheric Chemistry Modeling Group
lightning_nox_nl_mod.f input.geos Options Diagnostic Options Individual NOx sources : --- => Use aircraft NOx? : F => Use lightning NOx? : T => OTD reg redist? : T => OTD local redist?: F => Use CTH param? : T => Use MFLUX param? : F => Use PRECON param?: F %%% DIAGNOSTIC MENU %%% : ND56: Lightning flashes : 1 all Category: LFLASH-$ Tracer Names: L-RATE, IC-RATE, CG-RATE Tracer Numbers: 42001, 42002, 42003 Category: NOX-LI-$ Tracer Names: NOx Tracer Numbers: 1001 Lee T. Murray Harvard Atmospheric Chemistry Modeling Group