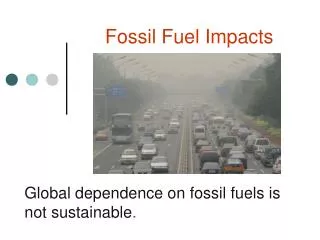
Download
1 / 2
30 likes | 120 Views
Verifying Fossil Fuel CO 2 Emissions with CMAQ Zhen Liu 1 Cosmin Safta 1 Khachik Sargsyan 1 Bart G. van Bloemen Waanders 2 Tao Zeng 3 Ray P. Bambha 1 Hope A. Michelsen 1 Sandia National Laboratories, 1 CA, 2 NM 3 Georgia Department of Natural Resources, GA zheliu@sandia.gov.

E N D
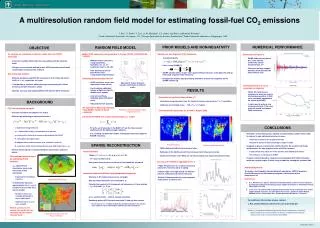
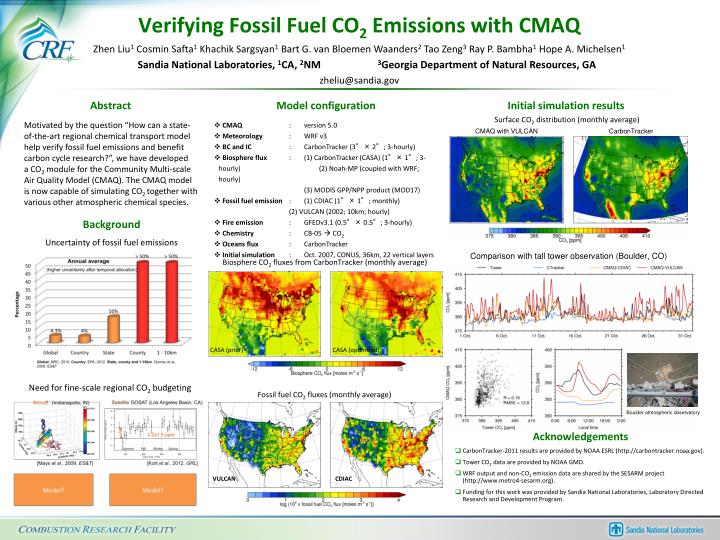
Verifying Fossil Fuel CO2 Emissions with CMAQ Zhen Liu1Cosmin Safta1Khachik Sargsyan1 Bart G. van Bloemen Waanders2 Tao Zeng3 Ray P. Bambha1 Hope A. Michelsen1 Sandia National Laboratories, 1CA, 2NM 3Georgia Department of Natural Resources, GA zheliu@sandia.gov Abstract Model configuration Initial simulation results Surface CO2 distribution (monthly average) Motivated by the question “How can a state- of-the-art regional chemical transport model help verify fossil fuel emissions and benefit carbon cycle research?”, we have developed a CO2 module for the Community Multi-scale Air Quality Model (CMAQ). The CMAQ model is now capable of simulating CO2 together with various other atmospheric chemical species. • CMAQ :version 5.0 • Meteorology : WRF v3 • BC and IC :CarbonTracker (3°× 2°; 3-hourly) • Biosphere flux : (1) CarbonTracker (CASA) (1°× 1°; 3-hourly) (2) Noah-MP (coupled with WRF; hourly) (3) MODIS GPP/NPP product (MOD17) • Fossil fuel emission : (1) CDIAC (1°× 1°; monthly) • (2) VULCAN (2002; 10km; hourly) • Fire emission : GFEDv3.1 (0.5°× 0.5°; 3-hourly) • Chemistry :CB-05 CO2 • Oceans flux :CarbonTracker • Initial simulation : Oct. 2007, CONUS, 36km, 22 vertical layers CMAQ with VULCAN CarbonTracker • Acknowledgements • CarbonTracker-2011 results are provided by NOAA ESRL (http://carbontracker.noaa.gov). • Tower CO2 data are provided by NOAA GMD. • WRF output and non-CO2 emission data are shared by the SESARM project (http://www.metro4-sesarm.org). • Funding for this work was provided by Sandia National Laboratories, Laboratory Directed Research and Development Program. Background Uncertainty of fossil fuel emissions Comparison with tall tower observation (Boulder, CO) Biosphere CO2 fluxes from CarbonTracker (monthly average) CASA (prior) CASA (optimized) Need for fine-scale regional CO2 budgeting Fossil fuel CO2 fluxes (monthly average) Boulder atmospheric observatory VULCAN CDIAC
CO2 and CO – emission and surface concentration patterns CO2 emission CO emission CO concentration CO2 concentration